Side-by-Side Comparison

Pear vs Pineapple

Factual nutritional comparison based on verified food composition records.
Compare other foods
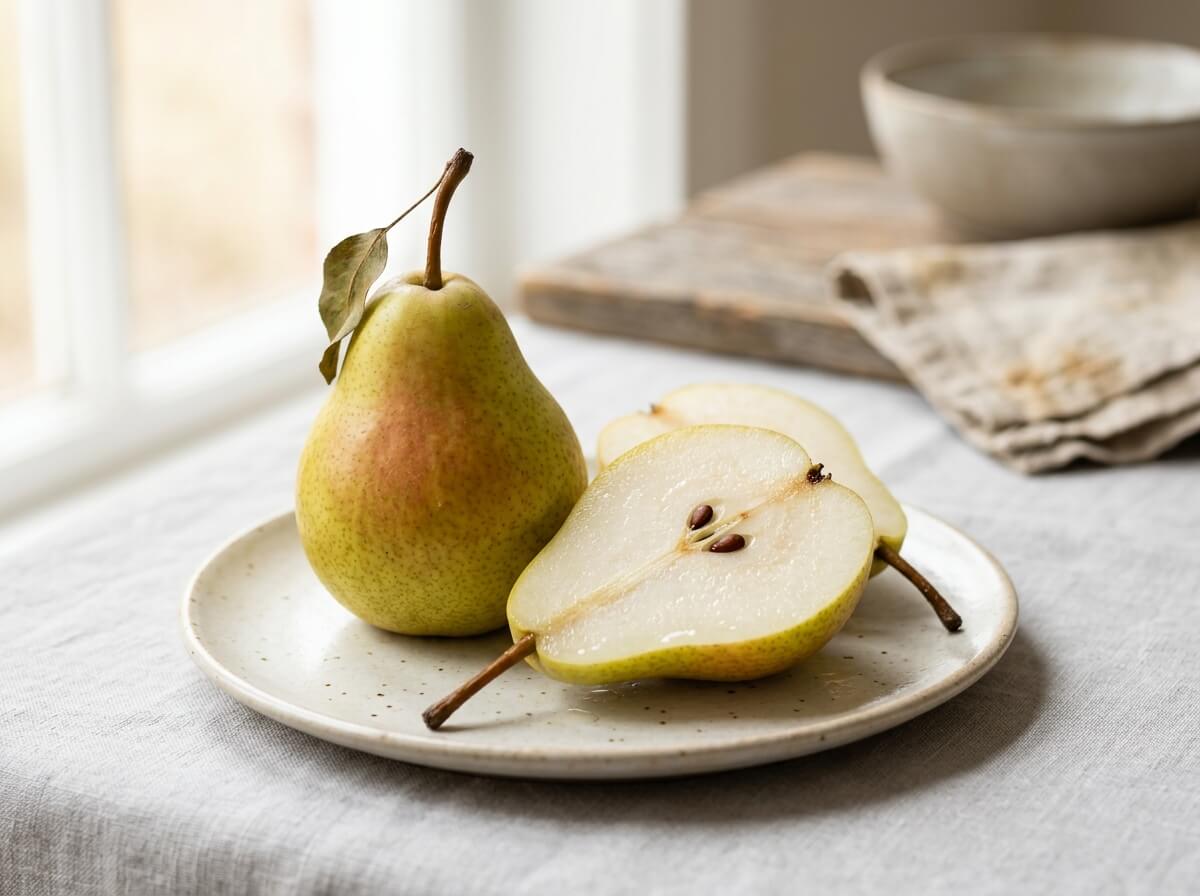
Fresh green Bartlett pear whole and sliced lengthwise on clean background
fruits

Pear

57Calories
0.4Protein
3.1Fiber
4.3Vit C
View Details
VS
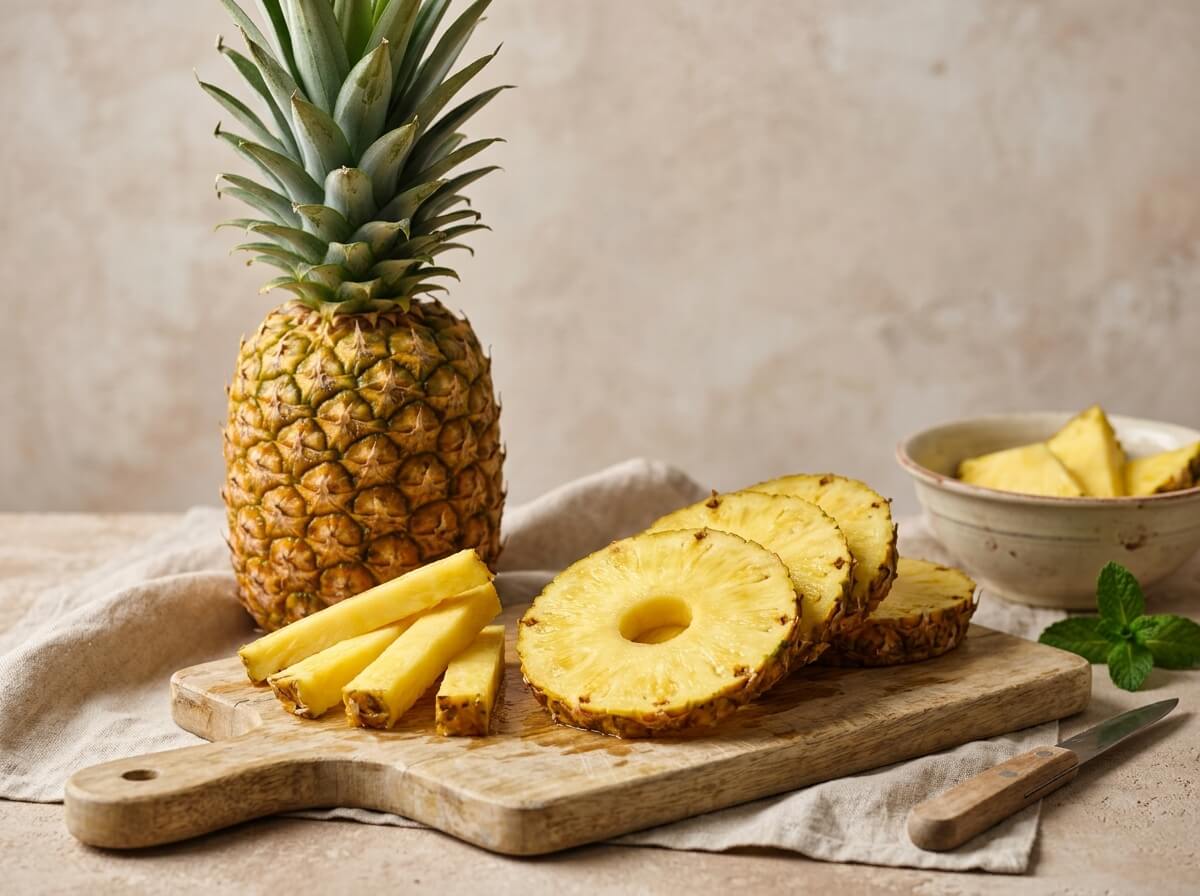
Fresh ripe pineapple whole and sliced into juicy golden spears
fruits

Pineapple

50Calories
0.5Protein
1.4Fiber
47.8Vit C
View Details
Highlights

Nutritional Takeaways

Based on standard 100g edible portion comparison

Lower Calories
-12%
Pineapple

Pineapple has fewer calories (energy) (50 kcal vs 57 kcal, 7 kcal less).

Higher Protein
+50%
Pineapple

Pineapple provides 0.54 g vs 0.36 g in Pear (+0.18 g, +50%).

Higher Dietary Fiber
+121%
Pear

Pear provides 3.1 g vs 1.4 g in Pineapple (+1.7 g, +121%).

Higher Vitamin C
+1012%
Pineapple

Pineapple provides 47.8 mg vs 4.3 mg in Pear (+43.5 mg, +1012%).

Comparing per 100 g standard edible portion.

Nutrient
Pear100 g edible portion
Pineapple100 g edible portion
Macronutrients6 nutrients
Calories (Energy)Pear higher
Pear
57 kcal3% DV
Pineapple
50 kcal3% DV

Pear provides 57 kcal vs 50 kcal in Pineapple (+7 kcal, +14%).

ProteinPineapple higher
Pear
0.36 g1% DV
Pineapple
0.54 g1% DV

Pineapple provides 0.54 g vs 0.36 g in Pear (+0.18 g, +50%).

CarbohydratesPear higher
Pear
15.2 g6% DV
Pineapple
13.1 g5% DV

Pear provides 15.2 g vs 13.1 g in Pineapple (+2.1 g, +16%).

Dietary FiberPear higher
Pear
3.1 g11% DV
Pineapple
1.4 g5% DV

Pear provides 3.1 g vs 1.4 g in Pineapple (+1.7 g, +121%).

Total FatSimilar
Pear
0.14 g
Pineapple
0.12 g

Both Pear and Pineapple provide similar amounts of total fat (0.14 g).

Total SugarsSimilar
Pear
9.8 g20% DV
Pineapple
9.9 g20% DV

Both Pear and Pineapple provide similar amounts of total sugars (9.8 g).

Vitamins12 nutrients
Vitamin CPineapple higher
Pear
4.3 mg5% DV
Pineapple
47.8 mg53% DV

Pineapple provides 47.8 mg vs 4.3 mg in Pear (+43.5 mg, +1012%).

Vitamin A (RAE)Pineapple higher
Pear
1.0 µg
Pineapple
3.0 µg

Pineapple provides 3.0 µg vs 1.0 µg in Pear (+2.0 µg, +200%).

Vitamin DSimilar
Pear
0 µg
Pineapple
0 µg

Both Pear and Pineapple provide similar amounts of vitamin d (0 µg).

Vitamin EPear higher
Pear
0.12 mg1% DV
Pineapple
0.02 mg

Pear provides slightly more vitamin e (0.12 mg vs 0.02 mg).

Vitamin KPear higher
Pear
4.4 µg4% DV
Pineapple
0.7 µg1% DV

Pear provides 4.4 µg vs 0.7 µg in Pineapple (+3.7 µg, +529%).

Folate (DFE)Pineapple higher
Pear
7.0 µg2% DV
Pineapple
18 µg5% DV

Pineapple provides 18 µg vs 7.0 µg in Pear (+11 µg, +157%).

Thiamin (Vitamin B1)Pineapple higher
Pear
0.01 mg1% DV
Pineapple
0.08 mg7% DV

Pineapple provides slightly more thiamin (vitamin b1) (0.08 mg vs 0.01 mg).

Riboflavin (Vitamin B2)Similar
Pear
0.03 mg2% DV
Pineapple
0.03 mg2% DV

Both Pear and Pineapple provide similar amounts of riboflavin (vitamin b2) (0.03 mg).

Niacin (Vitamin B3)Pineapple higher
Pear
0.16 mg1% DV
Pineapple
0.50 mg3% DV

Pineapple provides 0.50 mg vs 0.16 mg in Pear (+0.34 mg, +211%).

Pantothenic Acid (B5)Pineapple higher
Pear
0.05 mg1% DV
Pineapple
0.21 mg4% DV

Pineapple provides 0.21 mg vs 0.05 mg in Pear (+0.16 mg, +335%).

Vitamin B6Pineapple higher
Pear
0.03 mg2% DV
Pineapple
0.11 mg7% DV

Pineapple provides slightly more vitamin b6 (0.11 mg vs 0.03 mg).

Vitamin B12Similar
Pear
0 µg
Pineapple
0 µg

Both Pear and Pineapple provide similar amounts of vitamin b12 (0 µg).

Minerals7 nutrients
SodiumSimilar
Pear
1.0 mg
Pineapple
1.0 mg

Both Pear and Pineapple provide similar amounts of sodium (1.0 mg).

PotassiumPear higher
Pear
116 mg2% DV
Pineapple
109 mg2% DV

Pear provides 116 mg vs 109 mg in Pineapple (+7.0 mg, +6%).

CalciumPineapple higher
Pear
9.0 mg1% DV
Pineapple
13.0 mg1% DV

Pineapple provides 13.0 mg vs 9.0 mg in Pear (+4.0 mg, +44%).

IronPineapple higher
Pear
0.18 mg1% DV
Pineapple
0.29 mg2% DV

Pineapple provides 0.29 mg vs 0.18 mg in Pear (+0.11 mg, +61%).

MagnesiumPineapple higher
Pear
7.0 mg2% DV
Pineapple
12.0 mg3% DV

Pineapple provides 12.0 mg vs 7.0 mg in Pear (+5.0 mg, +71%).

PhosphorusPear higher
Pear
12.0 mg1% DV
Pineapple
8.0 mg1% DV

Pear provides 12.0 mg vs 8.0 mg in Pineapple (+4.0 mg, +50%).

ZincSimilar
Pear
0.10 mg1% DV
Pineapple
0.12 mg1% DV

Both Pear and Pineapple provide similar amounts of zinc (0.10 mg).

Lipids1 nutrients
Saturated FatSimilar
Pear
0.01 g
Pineapple
0.01 g

Both Pear and Pineapple provide similar amounts of saturated fat (0.01 g).

Comparison Summary

Based on 26 nutrients analyzed, Pear leads in 7 categories while Pineapple leads in 11.Both foods show similar concentrations in 8 nutrients. Overall, Pineapple has the nutritional edge in this comparison.

0 Foods
Compare (0/2)