Side-by-Side Comparison

Rolled Oats (Raw) vs Peaches & Nectarines

Factual nutritional comparison based on verified food composition records.
Compare other foods
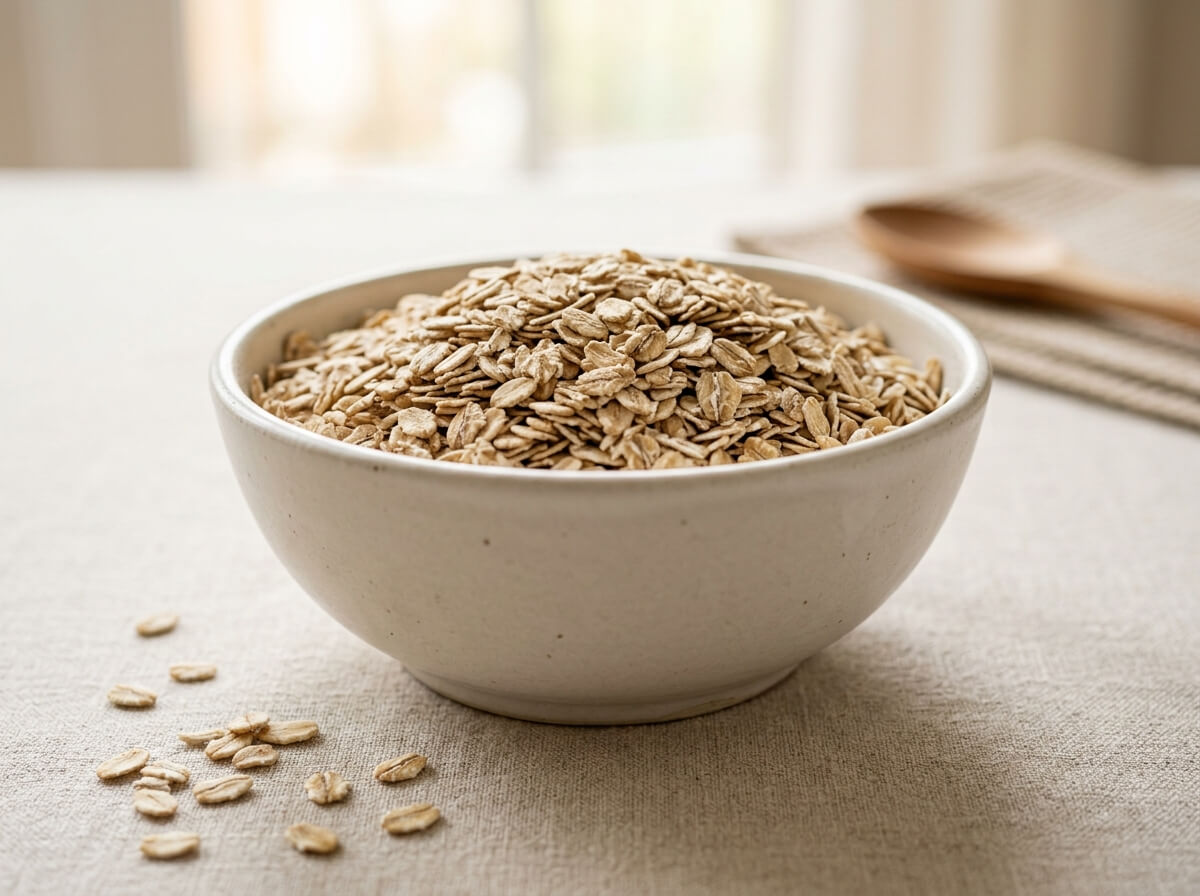
Clean whole rolled oats in a minimalist ceramic bowl
grains

Rolled Oats (Raw)

389Calories
16.9Protein
10.6Fiber
0.0Vit C
View Details
VS
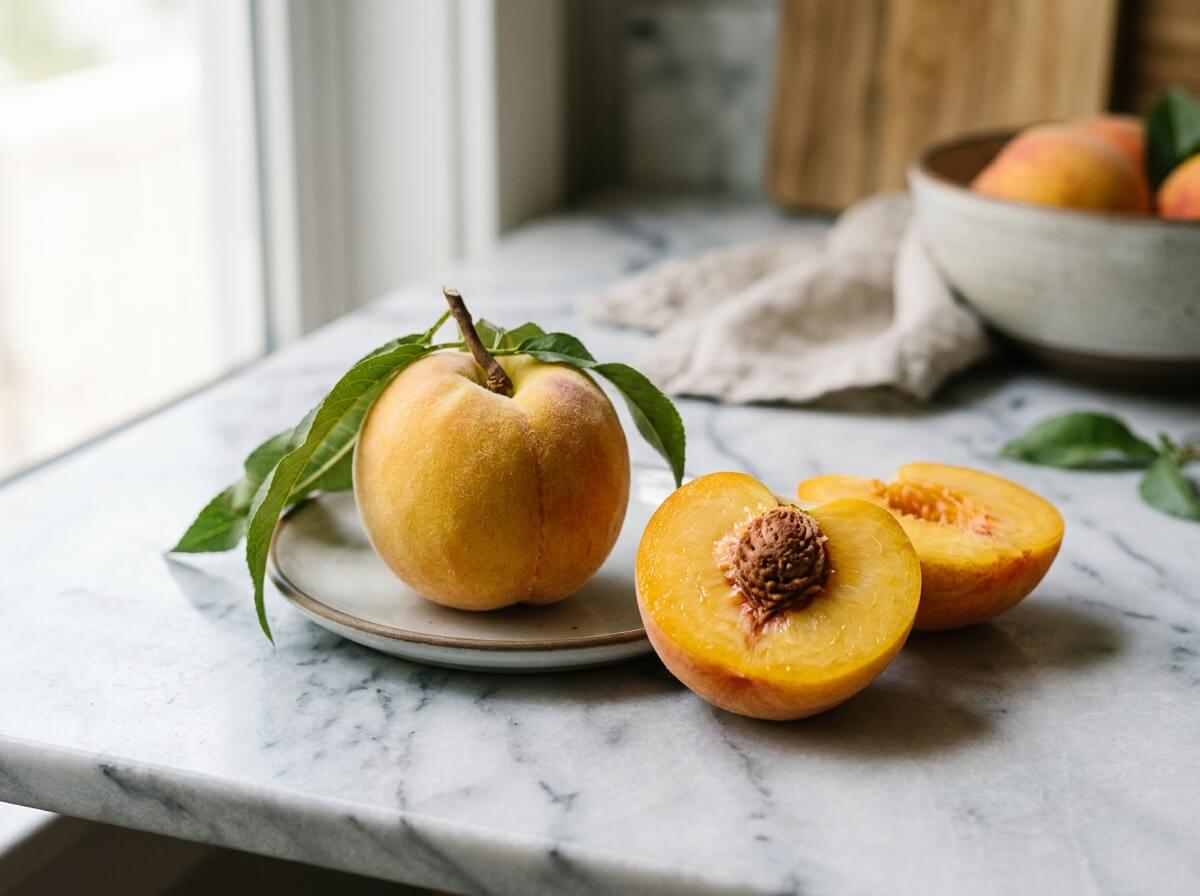
Ripe velvet-skinned peach sliced open showing juicy golden stone fruit flesh
fruits

Peaches & Nectarines

39Calories
0.9Protein
1.5Fiber
6.6Vit C
View Details
Highlights

Nutritional Takeaways

Based on standard 100g edible portion comparison

Lower Calories
-90%
Peaches & Nectarines

Peaches & Nectarines has fewer calories (energy) (39 kcal vs 389 kcal, 350 kcal less).

Higher Protein
+1756%
Rolled Oats (Raw)

Rolled Oats (Raw) provides 16.9 g vs 0.91 g in Peaches & Nectarines (+16.0 g, +1756%).

Higher Dietary Fiber
+607%
Rolled Oats (Raw)

Rolled Oats (Raw) provides 10.6 g vs 1.5 g in Peaches & Nectarines (+9.1 g, +607%).

Higher Vitamin C
Peaches & Nectarines

Peaches & Nectarines provides 6.6 mg vs 0 mg in Rolled Oats (Raw) (+6.6 mg).

Comparing per 100 g standard edible portion.

Nutrient
Rolled Oats (Raw)100 g edible portion
Peaches & Nectarines100 g edible portion
Macronutrients6 nutrients
Calories (Energy)Rolled Oats (Raw) higher
Rolled Oats (Raw)
389 kcal19% DV
Peaches & Nectarines
39 kcal2% DV

Rolled Oats (Raw) provides 389 kcal vs 39 kcal in Peaches & Nectarines (+350 kcal, +897%).

ProteinRolled Oats (Raw) higher
Rolled Oats (Raw)
16.9 g34% DV
Peaches & Nectarines
0.91 g2% DV

Rolled Oats (Raw) provides 16.9 g vs 0.91 g in Peaches & Nectarines (+16.0 g, +1756%).

CarbohydratesRolled Oats (Raw) higher
Rolled Oats (Raw)
66.3 g24% DV
Peaches & Nectarines
9.5 g3% DV

Rolled Oats (Raw) provides 66.3 g vs 9.5 g in Peaches & Nectarines (+56.7 g, +595%).

Dietary FiberRolled Oats (Raw) higher
Rolled Oats (Raw)
10.6 g38% DV
Peaches & Nectarines
1.5 g5% DV

Rolled Oats (Raw) provides 10.6 g vs 1.5 g in Peaches & Nectarines (+9.1 g, +607%).

Total FatRolled Oats (Raw) higher
Rolled Oats (Raw)
6.9 g9% DV
Peaches & Nectarines
0.25 g

Rolled Oats (Raw) provides 6.9 g vs 0.25 g in Peaches & Nectarines (+6.7 g, +2660%).

Total SugarsPeaches & Nectarines higher
Rolled Oats (Raw)
0.99 g2% DV
Peaches & Nectarines
8.4 g17% DV

Peaches & Nectarines provides 8.4 g vs 0.99 g in Rolled Oats (Raw) (+7.4 g, +747%).

Vitamins12 nutrients
Vitamin CPeaches & Nectarines higher
Rolled Oats (Raw)
0 mg
Peaches & Nectarines
6.6 mg7% DV

Peaches & Nectarines has higher vitamin c (6.6 mg vs 0 mg).

Vitamin A (RAE)Peaches & Nectarines higher
Rolled Oats (Raw)
0 µg
Peaches & Nectarines
16 µg2% DV

Peaches & Nectarines has higher vitamin a (rae) (16 µg vs 0 µg).

Vitamin DSimilar
Rolled Oats (Raw)
0 µg
Peaches & Nectarines
0 µg

Both Rolled Oats (Raw) and Peaches & Nectarines provide similar amounts of vitamin d (0 µg).

Vitamin EPeaches & Nectarines higher
Rolled Oats (Raw)
0.42 mg3% DV
Peaches & Nectarines
0.73 mg5% DV

Peaches & Nectarines provides 0.73 mg vs 0.42 mg in Rolled Oats (Raw) (+0.31 mg, +74%).

Vitamin KPeaches & Nectarines higher
Rolled Oats (Raw)
1.9 µg2% DV
Peaches & Nectarines
2.6 µg2% DV

Peaches & Nectarines provides 2.6 µg vs 1.9 µg in Rolled Oats (Raw) (+0.7 µg, +37%).

Folate (DFE)Rolled Oats (Raw) higher
Rolled Oats (Raw)
56 µg14% DV
Peaches & Nectarines
4.0 µg1% DV

Rolled Oats (Raw) provides 56 µg vs 4.0 µg in Peaches & Nectarines (+52 µg, +1300%).

Thiamin (Vitamin B1)Rolled Oats (Raw) higher
Rolled Oats (Raw)
0.76 mg64% DV
Peaches & Nectarines
0.02 mg2% DV

Rolled Oats (Raw) provides 0.76 mg vs 0.02 mg in Peaches & Nectarines (+0.74 mg, +3079%).

Riboflavin (Vitamin B2)Rolled Oats (Raw) higher
Rolled Oats (Raw)
0.14 mg11% DV
Peaches & Nectarines
0.03 mg2% DV

Rolled Oats (Raw) provides slightly more riboflavin (vitamin b2) (0.14 mg vs 0.03 mg).

Niacin (Vitamin B3)Rolled Oats (Raw) higher
Rolled Oats (Raw)
0.96 mg6% DV
Peaches & Nectarines
0.81 mg5% DV

Rolled Oats (Raw) provides 0.96 mg vs 0.81 mg in Peaches & Nectarines (+0.15 mg, +19%).

Pantothenic Acid (B5)Rolled Oats (Raw) higher
Rolled Oats (Raw)
1.3 mg27% DV
Peaches & Nectarines
0.15 mg3% DV

Rolled Oats (Raw) provides 1.3 mg vs 0.15 mg in Peaches & Nectarines (+1.2 mg, +782%).

Vitamin B6Rolled Oats (Raw) higher
Rolled Oats (Raw)
0.12 mg7% DV
Peaches & Nectarines
0.03 mg1% DV

Rolled Oats (Raw) provides slightly more vitamin b6 (0.12 mg vs 0.03 mg).

Vitamin B12Similar
Rolled Oats (Raw)
0 µg
Peaches & Nectarines
0 µg

Both Rolled Oats (Raw) and Peaches & Nectarines provide similar amounts of vitamin b12 (0 µg).

Minerals7 nutrients
SodiumRolled Oats (Raw) higher
Rolled Oats (Raw)
2.0 mg
Peaches & Nectarines
0 mg

Rolled Oats (Raw) has higher sodium (2.0 mg vs 0 mg).

PotassiumRolled Oats (Raw) higher
Rolled Oats (Raw)
429 mg9% DV
Peaches & Nectarines
190 mg4% DV

Rolled Oats (Raw) provides 429 mg vs 190 mg in Peaches & Nectarines (+239 mg, +126%).

CalciumRolled Oats (Raw) higher
Rolled Oats (Raw)
54.0 mg4% DV
Peaches & Nectarines
6.0 mg

Rolled Oats (Raw) provides 54.0 mg vs 6.0 mg in Peaches & Nectarines (+48.0 mg, +800%).

IronRolled Oats (Raw) higher
Rolled Oats (Raw)
4.7 mg26% DV
Peaches & Nectarines
0.25 mg1% DV

Rolled Oats (Raw) provides 4.7 mg vs 0.25 mg in Peaches & Nectarines (+4.5 mg, +1788%).

MagnesiumRolled Oats (Raw) higher
Rolled Oats (Raw)
177 mg42% DV
Peaches & Nectarines
9.0 mg2% DV

Rolled Oats (Raw) provides 177 mg vs 9.0 mg in Peaches & Nectarines (+168 mg, +1867%).

PhosphorusRolled Oats (Raw) higher
Rolled Oats (Raw)
523 mg42% DV
Peaches & Nectarines
20.0 mg2% DV

Rolled Oats (Raw) provides 523 mg vs 20.0 mg in Peaches & Nectarines (+503 mg, +2515%).

ZincRolled Oats (Raw) higher
Rolled Oats (Raw)
4.0 mg36% DV
Peaches & Nectarines
0.17 mg2% DV

Rolled Oats (Raw) provides 4.0 mg vs 0.17 mg in Peaches & Nectarines (+3.8 mg, +2235%).

Lipids1 nutrients
Saturated FatRolled Oats (Raw) higher
Rolled Oats (Raw)
1.2 g6% DV
Peaches & Nectarines
0.02 g

Rolled Oats (Raw) provides 1.2 g vs 0.02 g in Peaches & Nectarines (+1.2 g, +6321%).

Comparison Summary

Based on 26 nutrients analyzed, Rolled Oats (Raw) leads in 19 categories while Peaches & Nectarines leads in 5.Both foods show similar concentrations in 2 nutrients. Overall, Rolled Oats (Raw) has the nutritional edge in this comparison.

0 Foods
Compare (0/2)