Side-by-Side Comparison

Spinach (Raw) vs White Rice (Cooked)

Factual nutritional comparison based on verified food composition records.
Compare other foods
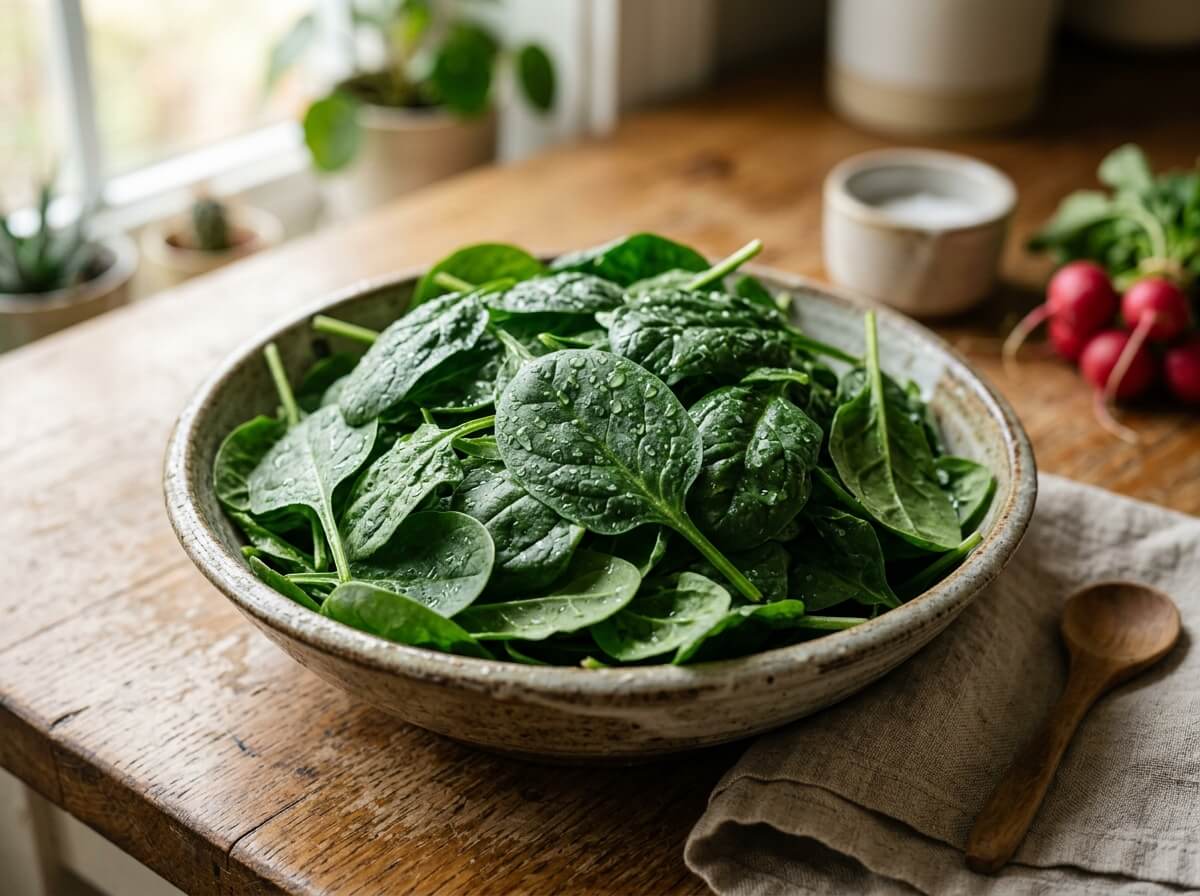
Crisp fresh dark green spinach leaves arranged on clean studio surface
vegetables

Spinach (Raw)

23Calories
2.9Protein
2.2Fiber
28.1Vit C
View Details
VS
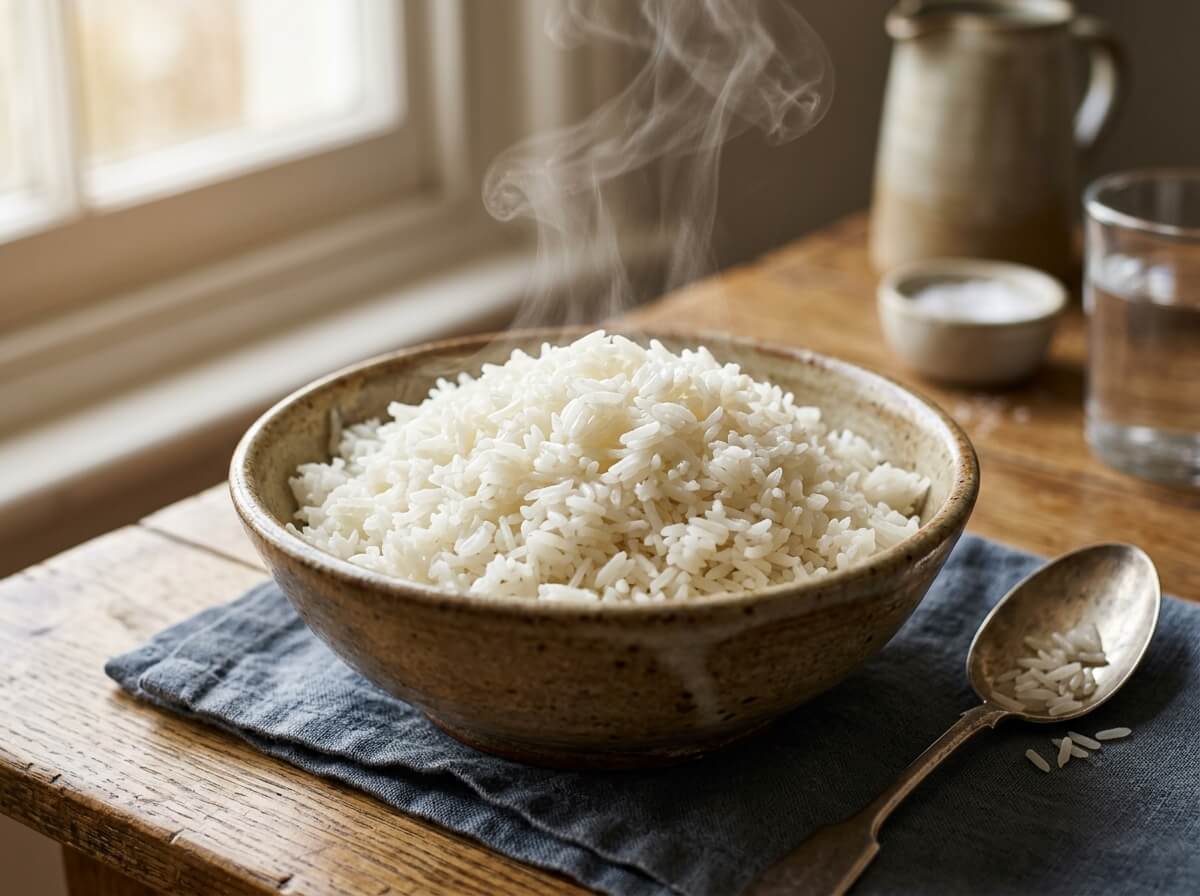
Clean fluffy steamed long-grain white rice in neutral ceramic bowl
grains

White Rice (Cooked)

130Calories
2.7Protein
0.4Fiber
0.0Vit C
View Details
Preparation State Notice

Comparing Spinach (Raw) (raw) with White Rice (Cooked) (cooked). Moisture variations and cooking state affect nutrient concentrations.

Highlights

Nutritional Takeaways

Based on standard 100g edible portion comparison

Lower Calories
-82%
Spinach (Raw)

Spinach (Raw) has fewer calories (energy) (23 kcal vs 130 kcal, 107 kcal less).

Higher Protein
+6%
Spinach (Raw)

Spinach (Raw) provides 2.9 g vs 2.7 g in White Rice (Cooked) (+0.17 g, +6%).

Higher Dietary Fiber
+450%
Spinach (Raw)

Spinach (Raw) provides 2.2 g vs 0.40 g in White Rice (Cooked) (+1.8 g, +450%).

Higher Vitamin C
Spinach (Raw)

Spinach (Raw) provides 28.1 mg vs 0 mg in White Rice (Cooked) (+28.1 mg).

Comparing per 100 g standard edible portion.

Nutrient
Spinach (Raw)100 g edible portion
White Rice (Cooked)100 g edible portion
Macronutrients6 nutrients
Calories (Energy)White Rice (Cooked) higher
Spinach (Raw)
23 kcal1% DV
White Rice (Cooked)
130 kcal7% DV

White Rice (Cooked) provides 130 kcal vs 23 kcal in Spinach (Raw) (+107 kcal, +465%).

ProteinSpinach (Raw) higher
Spinach (Raw)
2.9 g6% DV
White Rice (Cooked)
2.7 g5% DV

Spinach (Raw) provides 2.9 g vs 2.7 g in White Rice (Cooked) (+0.17 g, +6%).

CarbohydratesWhite Rice (Cooked) higher
Spinach (Raw)
3.6 g1% DV
White Rice (Cooked)
28.2 g10% DV

White Rice (Cooked) provides 28.2 g vs 3.6 g in Spinach (Raw) (+24.5 g, +676%).

Dietary FiberSpinach (Raw) higher
Spinach (Raw)
2.2 g8% DV
White Rice (Cooked)
0.40 g1% DV

Spinach (Raw) provides 2.2 g vs 0.40 g in White Rice (Cooked) (+1.8 g, +450%).

Total FatSpinach (Raw) higher
Spinach (Raw)
0.39 g1% DV
White Rice (Cooked)
0.28 g

Spinach (Raw) provides 0.39 g vs 0.28 g in White Rice (Cooked) (+0.11 g, +39%).

Total SugarsSpinach (Raw) higher
Spinach (Raw)
0.42 g1% DV
White Rice (Cooked)
0.05 g

Spinach (Raw) provides 0.42 g vs 0.05 g in White Rice (Cooked) (+0.37 g, +740%).

Vitamins12 nutrients
Vitamin CSpinach (Raw) higher
Spinach (Raw)
28.1 mg31% DV
White Rice (Cooked)
0 mg

Spinach (Raw) has higher vitamin c (28.1 mg vs 0 mg).

Vitamin A (RAE)Spinach (Raw) higher
Spinach (Raw)
469 µg52% DV
White Rice (Cooked)
0 µg

Spinach (Raw) has higher vitamin a (rae) (469 µg vs 0 µg).

Vitamin DSimilar
Spinach (Raw)
0 µg
White Rice (Cooked)
0 µg

Both Spinach (Raw) and White Rice (Cooked) provide similar amounts of vitamin d (0 µg).

Vitamin ESpinach (Raw) higher
Spinach (Raw)
2.0 mg14% DV
White Rice (Cooked)
0.04 mg

Spinach (Raw) provides 2.0 mg vs 0.04 mg in White Rice (Cooked) (+2.0 mg, +4975%).

Vitamin KSpinach (Raw) higher
Spinach (Raw)
483 µg402% DV
White Rice (Cooked)
0.1 µg

Spinach (Raw) provides 483 µg vs 0.1 µg in White Rice (Cooked) (+483 µg, +482800%).

Folate (DFE)Spinach (Raw) higher
Spinach (Raw)
194 µg49% DV
White Rice (Cooked)
58 µg14% DV

Spinach (Raw) provides 194 µg vs 58 µg in White Rice (Cooked) (+136 µg, +234%).

Thiamin (Vitamin B1)White Rice (Cooked) higher
Spinach (Raw)
0.08 mg7% DV
White Rice (Cooked)
0.16 mg14% DV

White Rice (Cooked) provides slightly more thiamin (vitamin b1) (0.16 mg vs 0.08 mg).

Riboflavin (Vitamin B2)Spinach (Raw) higher
Spinach (Raw)
0.19 mg15% DV
White Rice (Cooked)
0.01 mg1% DV

Spinach (Raw) provides slightly more riboflavin (vitamin b2) (0.19 mg vs 0.01 mg).

Niacin (Vitamin B3)White Rice (Cooked) higher
Spinach (Raw)
0.72 mg5% DV
White Rice (Cooked)
1.5 mg9% DV

White Rice (Cooked) provides 1.5 mg vs 0.72 mg in Spinach (Raw) (+0.75 mg, +104%).

Pantothenic Acid (B5)White Rice (Cooked) higher
Spinach (Raw)
0.07 mg1% DV
White Rice (Cooked)
0.40 mg8% DV

White Rice (Cooked) provides 0.40 mg vs 0.07 mg in Spinach (Raw) (+0.33 mg, +508%).

Vitamin B6Spinach (Raw) higher
Spinach (Raw)
0.20 mg11% DV
White Rice (Cooked)
0.09 mg5% DV

Spinach (Raw) provides slightly more vitamin b6 (0.20 mg vs 0.09 mg).

Vitamin B12Similar
Spinach (Raw)
0 µg
White Rice (Cooked)
0 µg

Both Spinach (Raw) and White Rice (Cooked) provide similar amounts of vitamin b12 (0 µg).

Minerals7 nutrients
SodiumSpinach (Raw) higher
Spinach (Raw)
79.0 mg3% DV
White Rice (Cooked)
1.0 mg

Spinach (Raw) provides 79.0 mg vs 1.0 mg in White Rice (Cooked) (+78.0 mg, +7800%).

PotassiumSpinach (Raw) higher
Spinach (Raw)
558 mg12% DV
White Rice (Cooked)
35.0 mg1% DV

Spinach (Raw) provides 558 mg vs 35.0 mg in White Rice (Cooked) (+523 mg, +1494%).

CalciumSpinach (Raw) higher
Spinach (Raw)
99.0 mg8% DV
White Rice (Cooked)
10.0 mg1% DV

Spinach (Raw) provides 99.0 mg vs 10.0 mg in White Rice (Cooked) (+89.0 mg, +890%).

IronSpinach (Raw) higher
Spinach (Raw)
2.7 mg15% DV
White Rice (Cooked)
1.2 mg7% DV

Spinach (Raw) provides 2.7 mg vs 1.2 mg in White Rice (Cooked) (+1.5 mg, +126%).

MagnesiumSpinach (Raw) higher
Spinach (Raw)
79.0 mg19% DV
White Rice (Cooked)
12.0 mg3% DV

Spinach (Raw) provides 79.0 mg vs 12.0 mg in White Rice (Cooked) (+67.0 mg, +558%).

PhosphorusSpinach (Raw) higher
Spinach (Raw)
49.0 mg4% DV
White Rice (Cooked)
43.0 mg3% DV

Spinach (Raw) provides 49.0 mg vs 43.0 mg in White Rice (Cooked) (+6.0 mg, +14%).

ZincSimilar
Spinach (Raw)
0.53 mg5% DV
White Rice (Cooked)
0.49 mg4% DV

Both Spinach (Raw) and White Rice (Cooked) provide similar amounts of zinc (0.53 mg).

Lipids1 nutrients
Saturated FatSimilar
Spinach (Raw)
0.06 g
White Rice (Cooked)
0.08 g

Both Spinach (Raw) and White Rice (Cooked) provide similar amounts of saturated fat (0.06 g).

Comparison Summary

Based on 26 nutrients analyzed, Spinach (Raw) leads in 17 categories while White Rice (Cooked) leads in 5.Both foods show similar concentrations in 4 nutrients. Overall, Spinach (Raw) has the nutritional edge in this comparison.

0 Foods
Compare (0/2)