Compara Nutrición Lado a Lado

Melocotones y Nectarinas vs Piña

Selecciona dos alimentos y compara macronutrientes, vitaminas y minerales lado a lado: por 100g, por porción o normalizado a calorías iguales.
Comparaciones Populares
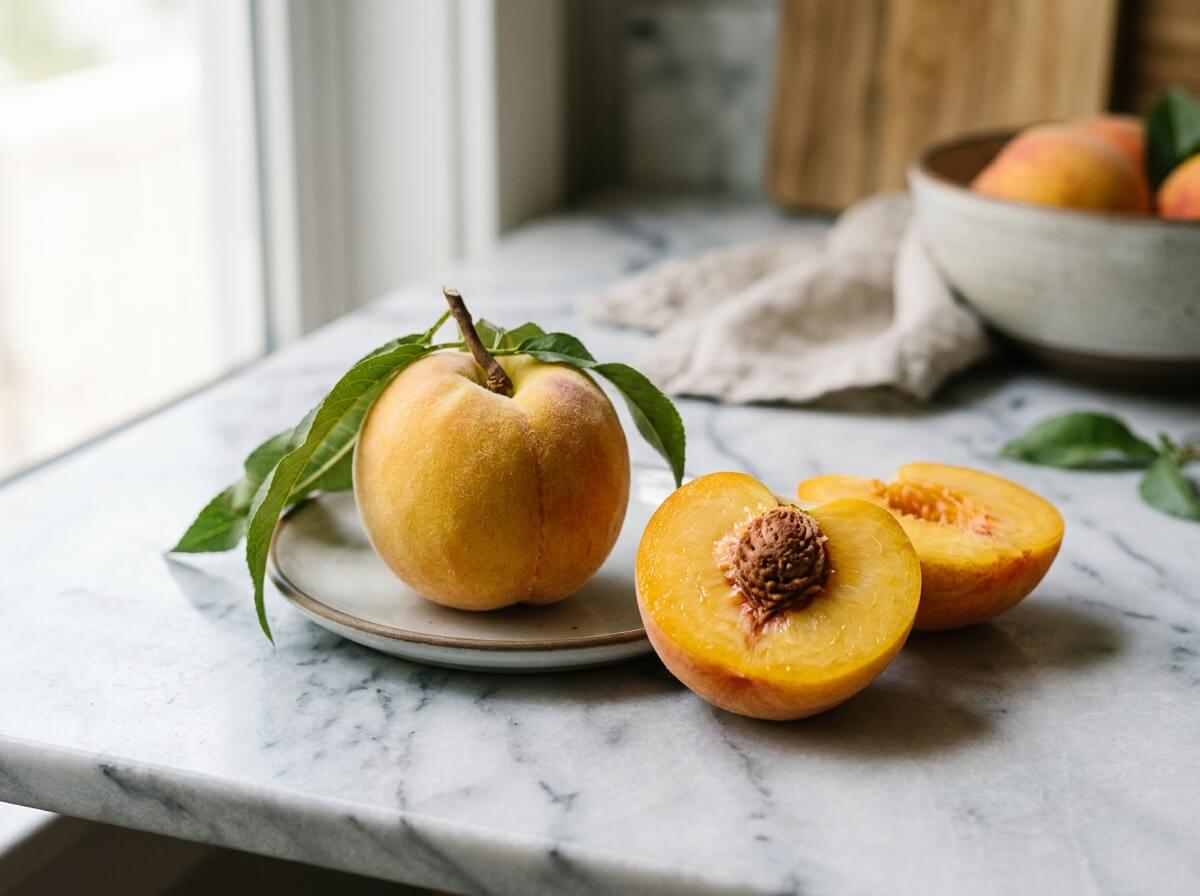
Ripe velvet-skinned peach sliced open showing juicy golden stone fruit flesh
Frutas

Melocotones y Nectarinas

39Calorías
0.9Proteína
1.5Fibra
6.6Vitamina C
Ver Detalles
VS
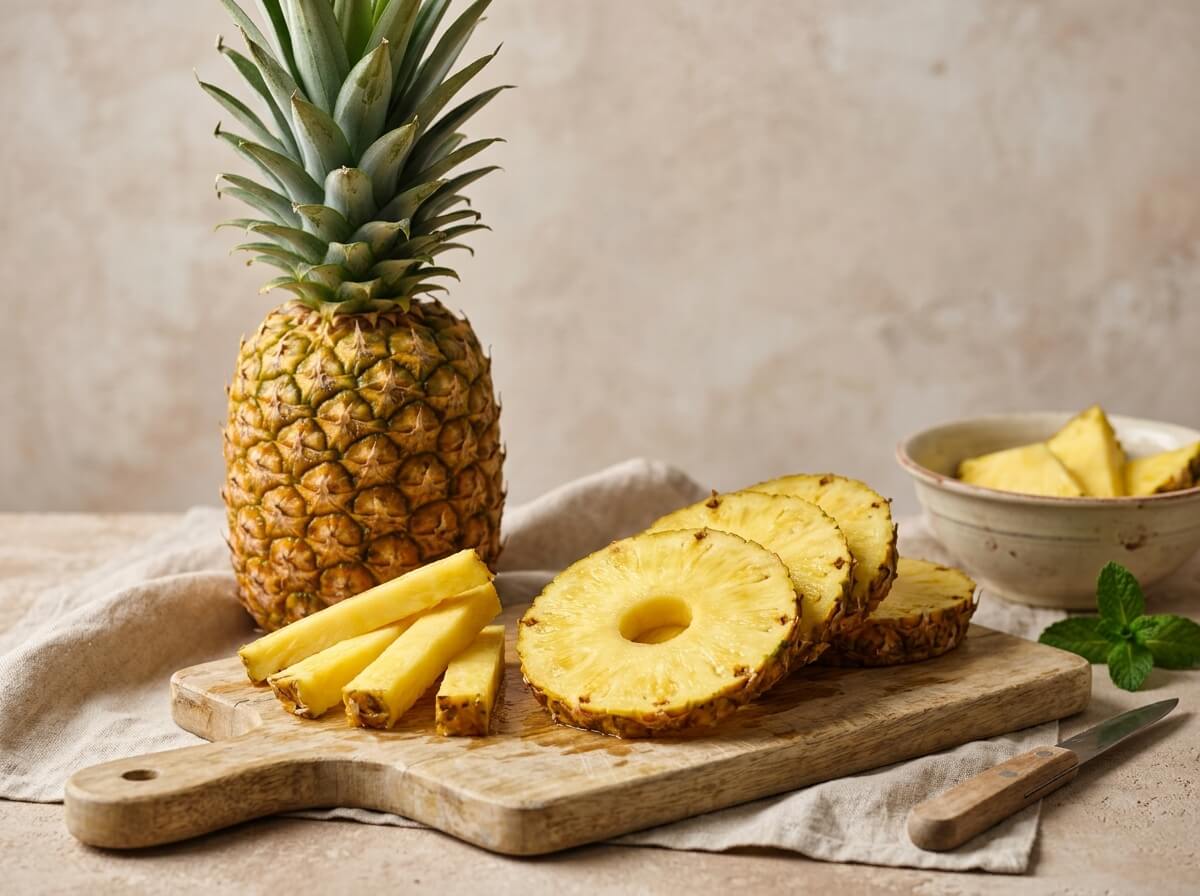
Fresh ripe pineapple whole and sliced into juicy golden spears
Frutas

Piña

50Calorías
0.5Proteína
1.4Fibra
47.8Vitamina C
Ver Detalles
Highlights

Nutritional Takeaways

Based on standard 100g edible portion comparison

Menos Calorías
-22%
Melocotones y Nectarinas

Peaches & Nectarines has fewer calories (energy) (39 kcal vs 50 kcal, 11 kcal less).

Más Proteína
+69%
Melocotones y Nectarinas

Peaches & Nectarines provides 0.91 g vs 0.54 g in Pineapple (+0.37 g, +69%).

Más Fibra
+7%
Melocotones y Nectarinas

Peaches & Nectarines provides 1.5 g vs 1.4 g in Pineapple (+0.10 g, +7%).

Más Vitamina C
+624%
Piña

Pineapple provides 47.8 mg vs 6.6 mg in Peaches & Nectarines (+41.2 mg, +624%).

Comparing per 100 g standard edible portion.

Nutriente
Melocotones y Nectarinas100 g edible portion
Piña100 g edible portion
Macronutrientes6 nutrientes
Calorías (Energía)Piña más alto
Melocotones y Nectarinas
39 kcal2% VD
Piña
50 kcal3% VD

Pineapple provides 50 kcal vs 39 kcal in Peaches & Nectarines (+11 kcal, +28%).

ProteínaMelocotones y Nectarinas más alto
Melocotones y Nectarinas
0.91 g2% VD
Piña
0.54 g1% VD

Peaches & Nectarines provides 0.91 g vs 0.54 g in Pineapple (+0.37 g, +69%).

CarbohidratosPiña más alto
Melocotones y Nectarinas
9.5 g3% VD
Piña
13.1 g5% VD

Pineapple provides 13.1 g vs 9.5 g in Peaches & Nectarines (+3.6 g, +38%).

Fibra DietéticaMelocotones y Nectarinas más alto
Melocotones y Nectarinas
1.5 g5% VD
Piña
1.4 g5% VD

Peaches & Nectarines provides 1.5 g vs 1.4 g in Pineapple (+0.10 g, +7%).

Grasa TotalMelocotones y Nectarinas más alto
Melocotones y Nectarinas
0.25 g
Piña
0.12 g

Peaches & Nectarines provides 0.25 g vs 0.12 g in Pineapple (+0.13 g, +108%).

AzúcaresPiña más alto
Melocotones y Nectarinas
8.4 g17% VD
Piña
9.9 g20% VD

Pineapple provides 9.9 g vs 8.4 g in Peaches & Nectarines (+1.5 g, +17%).

Vitaminas12 nutrientes
Vitamina CPiña más alto
Melocotones y Nectarinas
6.6 mg7% VD
Piña
47.8 mg53% VD

Pineapple provides 47.8 mg vs 6.6 mg in Peaches & Nectarines (+41.2 mg, +624%).

Vitamina AMelocotones y Nectarinas más alto
Melocotones y Nectarinas
16 µg2% VD
Piña
3.0 µg

Peaches & Nectarines provides 16 µg vs 3.0 µg in Pineapple (+13 µg, +433%).

Vitamina DSimilar
Melocotones y Nectarinas
0 µg
Piña
0 µg

Both Peaches & Nectarines and Pineapple provide similar amounts of vitamin d (0 µg).

Vitamina EMelocotones y Nectarinas más alto
Melocotones y Nectarinas
0.73 mg5% VD
Piña
0.02 mg

Peaches & Nectarines provides 0.73 mg vs 0.02 mg in Pineapple (+0.71 mg, +3550%).

Vitamina KMelocotones y Nectarinas más alto
Melocotones y Nectarinas
2.6 µg2% VD
Piña
0.7 µg1% VD

Peaches & Nectarines provides 2.6 µg vs 0.7 µg in Pineapple (+1.9 µg, +271%).

Ácido FólicoPiña más alto
Melocotones y Nectarinas
4.0 µg1% VD
Piña
18 µg5% VD

Pineapple provides 18 µg vs 4.0 µg in Peaches & Nectarines (+14 µg, +350%).

Vitamina B1 (Tiamina)Piña más alto
Melocotones y Nectarinas
0.02 mg2% VD
Piña
0.08 mg7% VD

Pineapple provides slightly more thiamin (vitamin b1) (0.08 mg vs 0.02 mg).

Vitamina B2 (Riboflavina)Similar
Melocotones y Nectarinas
0.03 mg2% VD
Piña
0.03 mg2% VD

Both Peaches & Nectarines and Pineapple provide similar amounts of riboflavin (vitamin b2) (0.03 mg).

Vitamina B3 (Niacina)Melocotones y Nectarinas más alto
Melocotones y Nectarinas
0.81 mg5% VD
Piña
0.50 mg3% VD

Peaches & Nectarines provides 0.81 mg vs 0.50 mg in Pineapple (+0.31 mg, +61%).

Vitamina B5Piña más alto
Melocotones y Nectarinas
0.15 mg3% VD
Piña
0.21 mg4% VD

Pineapple provides 0.21 mg vs 0.15 mg in Peaches & Nectarines (+0.06 mg, +39%).

Vitamina B6Piña más alto
Melocotones y Nectarinas
0.03 mg1% VD
Piña
0.11 mg7% VD

Pineapple provides slightly more vitamin b6 (0.11 mg vs 0.03 mg).

Vitamina B12Similar
Melocotones y Nectarinas
0 µg
Piña
0 µg

Both Peaches & Nectarines and Pineapple provide similar amounts of vitamin b12 (0 µg).

Minerales7 nutrientes
SodioPiña más alto
Melocotones y Nectarinas
0 mg
Piña
1.0 mg

Pineapple has higher sodium (1.0 mg vs 0 mg).

PotasioMelocotones y Nectarinas más alto
Melocotones y Nectarinas
190 mg4% VD
Piña
109 mg2% VD

Peaches & Nectarines provides 190 mg vs 109 mg in Pineapple (+81.0 mg, +74%).

CalcioPiña más alto
Melocotones y Nectarinas
6.0 mg
Piña
13.0 mg1% VD

Pineapple provides 13.0 mg vs 6.0 mg in Peaches & Nectarines (+7.0 mg, +117%).

HierroSimilar
Melocotones y Nectarinas
0.25 mg1% VD
Piña
0.29 mg2% VD

Both Peaches & Nectarines and Pineapple provide similar amounts of iron (0.25 mg).

MagnesioPiña más alto
Melocotones y Nectarinas
9.0 mg2% VD
Piña
12.0 mg3% VD

Pineapple provides 12.0 mg vs 9.0 mg in Peaches & Nectarines (+3.0 mg, +33%).

FósforoMelocotones y Nectarinas más alto
Melocotones y Nectarinas
20.0 mg2% VD
Piña
8.0 mg1% VD

Peaches & Nectarines provides 20.0 mg vs 8.0 mg in Pineapple (+12.0 mg, +150%).

ZincMelocotones y Nectarinas más alto
Melocotones y Nectarinas
0.17 mg2% VD
Piña
0.12 mg1% VD

Peaches & Nectarines provides slightly more zinc (0.17 mg vs 0.12 mg).

Lípidos1 nutrientes
Grasa SaturadaSimilar
Melocotones y Nectarinas
0.02 g
Piña
0.01 g

Both Peaches & Nectarines and Pineapple provide similar amounts of saturated fat (0.02 g).

Resumen de la Comparación

Based on 26 nutrients analyzed, Peaches & Nectarines leads in 10 categories while Pineapple leads in 11.Both foods show similar concentrations in 5 nutrients. Overall, Piña has the nutritional edge in this comparison.

0 Alimentos
Comparar (0/2)