Confronta la Nutrizione Fianco a Fianco

Riso Integrale vs Pera

Seleziona due alimenti e confronta macronutrienti, vitamine e minerali fianco a fianco: per 100g, per porzione o normalizzati per calorie.
Confronti Popolari
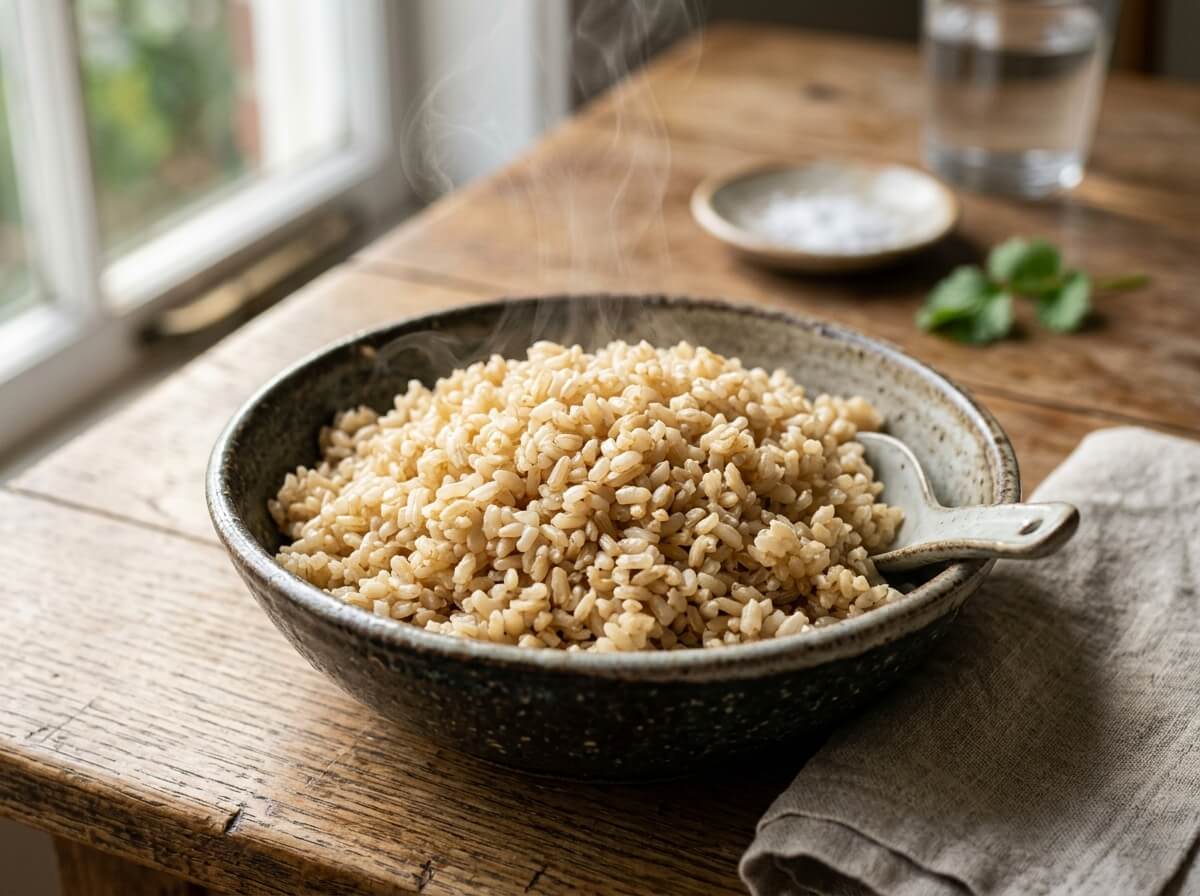
Nutty cooked whole grain brown rice in minimalist stoneware dish
Cereali

Riso Integrale

123Calorie
2.7Proteine
1.6Fibre
0.0Vitamina C
Vedi Dettagli
VS
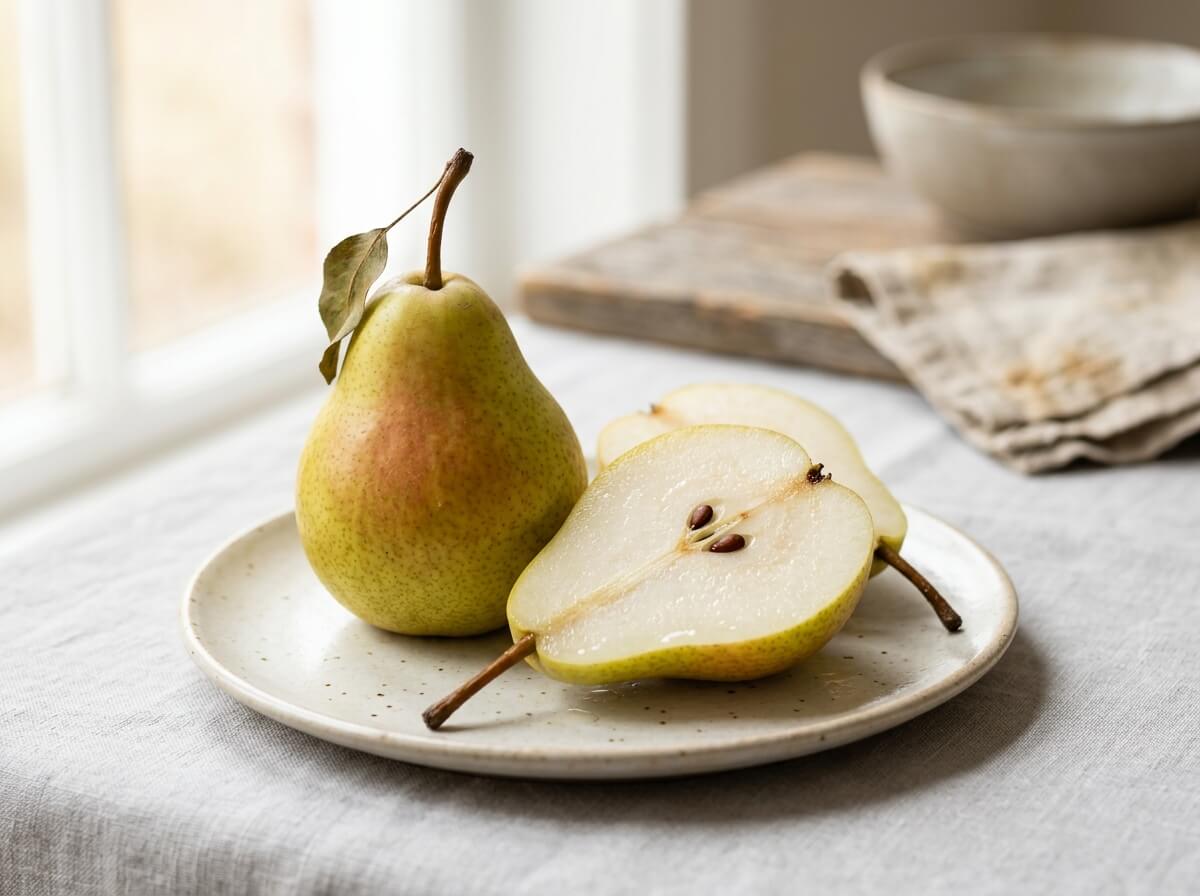
Fresh green Bartlett pear whole and sliced lengthwise on clean background
Frutta

Pera

57Calorie
0.4Proteine
3.1Fibre
4.3Vitamina C
Vedi Dettagli
Preparation State Notice

Comparing Brown Rice (Cooked) (cooked) with Pear (raw). Moisture variations and cooking state affect nutrient concentrations.

Highlights

Nutritional Takeaways

Based on standard 100g edible portion comparison

Meno Calorie
-54%
Pera

Pear has fewer calories (energy) (57 kcal vs 123 kcal, 66 kcal less).

Più Proteine
+661%
Riso Integrale

Brown Rice (Cooked) provides 2.7 g vs 0.36 g in Pear (+2.4 g, +661%).

Più Fibre
+94%
Pera

Pear provides 3.1 g vs 1.6 g in Brown Rice (Cooked) (+1.5 g, +94%).

Più Vitamina C
Pera

Pear provides 4.3 mg vs 0 mg in Brown Rice (Cooked) (+4.3 mg).

Comparing per 100 g standard edible portion.

Nutriente
Riso Integrale100 g edible portion
Pera100 g edible portion
Macronutrienti6 nutrienti
Calorie (Energia)Riso Integrale più alto
Riso Integrale
123 kcal6% VG
Pera
57 kcal3% VG

Brown Rice (Cooked) provides 123 kcal vs 57 kcal in Pear (+66 kcal, +116%).

ProteineRiso Integrale più alto
Riso Integrale
2.7 g5% VG
Pera
0.36 g1% VG

Brown Rice (Cooked) provides 2.7 g vs 0.36 g in Pear (+2.4 g, +661%).

CarboidratiRiso Integrale più alto
Riso Integrale
25.6 g9% VG
Pera
15.2 g6% VG

Brown Rice (Cooked) provides 25.6 g vs 15.2 g in Pear (+10.3 g, +68%).

Fibra AlimentarePera più alto
Riso Integrale
1.6 g6% VG
Pera
3.1 g11% VG

Pear provides 3.1 g vs 1.6 g in Brown Rice (Cooked) (+1.5 g, +94%).

Grassi TotaliRiso Integrale più alto
Riso Integrale
0.97 g1% VG
Pera
0.14 g

Brown Rice (Cooked) provides 0.97 g vs 0.14 g in Pear (+0.83 g, +593%).

ZuccheriPera più alto
Riso Integrale
0.24 g
Pera
9.8 g20% VG

Pear provides 9.8 g vs 0.24 g in Brown Rice (Cooked) (+9.5 g, +3963%).

Vitamine12 nutrienti
Vitamina CPera più alto
Riso Integrale
0 mg
Pera
4.3 mg5% VG

Pear has higher vitamin c (4.3 mg vs 0 mg).

Vitamina APera più alto
Riso Integrale
0 µg
Pera
1.0 µg

Pear has higher vitamin a (rae) (1.0 µg vs 0 µg).

Vitamina DSimile
Riso Integrale
0 µg
Pera
0 µg

Both Brown Rice (Cooked) and Pear provide similar amounts of vitamin d (0 µg).

Vitamina ESimile
Riso Integrale
0.07 mg
Pera
0.12 mg1% VG

Both Brown Rice (Cooked) and Pear provide similar amounts of vitamin e (0.07 mg).

Vitamina KPera più alto
Riso Integrale
0.6 µg1% VG
Pera
4.4 µg4% VG

Pear provides 4.4 µg vs 0.6 µg in Brown Rice (Cooked) (+3.8 µg, +633%).

Acido FolicoRiso Integrale più alto
Riso Integrale
9.0 µg2% VG
Pera
7.0 µg2% VG

Brown Rice (Cooked) provides 9.0 µg vs 7.0 µg in Pear (+2.0 µg, +29%).

Vitamina B1 (Tiamina)Riso Integrale più alto
Riso Integrale
0.18 mg15% VG
Pera
0.01 mg1% VG

Brown Rice (Cooked) provides slightly more thiamin (vitamin b1) (0.18 mg vs 0.01 mg).

Vitamina B2 (Riboflavina)Simile
Riso Integrale
0.07 mg5% VG
Pera
0.03 mg2% VG

Both Brown Rice (Cooked) and Pear provide similar amounts of riboflavin (vitamin b2) (0.07 mg).

Vitamina B3 (Niacina)Riso Integrale più alto
Riso Integrale
2.6 mg16% VG
Pera
0.16 mg1% VG

Brown Rice (Cooked) provides 2.6 mg vs 0.16 mg in Pear (+2.4 mg, +1491%).

Vitamina B5Riso Integrale più alto
Riso Integrale
0.73 mg14% VG
Pera
0.05 mg1% VG

Brown Rice (Cooked) provides 0.73 mg vs 0.05 mg in Pear (+0.68 mg, +1380%).

Vitamina B6Riso Integrale più alto
Riso Integrale
0.15 mg9% VG
Pera
0.03 mg2% VG

Brown Rice (Cooked) provides slightly more vitamin b6 (0.15 mg vs 0.03 mg).

Vitamina B12Simile
Riso Integrale
0 µg
Pera
0 µg

Both Brown Rice (Cooked) and Pear provide similar amounts of vitamin b12 (0 µg).

Minerali7 nutrienti
SodioRiso Integrale più alto
Riso Integrale
4.0 mg
Pera
1.0 mg

Brown Rice (Cooked) provides 4.0 mg vs 1.0 mg in Pear (+3.0 mg, +300%).

PotassioPera più alto
Riso Integrale
86.0 mg2% VG
Pera
116 mg2% VG

Pear provides 116 mg vs 86.0 mg in Brown Rice (Cooked) (+30.0 mg, +35%).

CalcioRiso Integrale più alto
Riso Integrale
10.0 mg1% VG
Pera
9.0 mg1% VG

Brown Rice (Cooked) provides 10.0 mg vs 9.0 mg in Pear (+1.0 mg, +11%).

FerroRiso Integrale più alto
Riso Integrale
0.56 mg3% VG
Pera
0.18 mg1% VG

Brown Rice (Cooked) provides 0.56 mg vs 0.18 mg in Pear (+0.38 mg, +211%).

MagnesioRiso Integrale più alto
Riso Integrale
44.0 mg10% VG
Pera
7.0 mg2% VG

Brown Rice (Cooked) provides 44.0 mg vs 7.0 mg in Pear (+37.0 mg, +529%).

FosforoRiso Integrale più alto
Riso Integrale
103 mg8% VG
Pera
12.0 mg1% VG

Brown Rice (Cooked) provides 103 mg vs 12.0 mg in Pear (+91.0 mg, +758%).

ZincoRiso Integrale più alto
Riso Integrale
0.71 mg6% VG
Pera
0.10 mg1% VG

Brown Rice (Cooked) provides 0.71 mg vs 0.10 mg in Pear (+0.61 mg, +610%).

Lipidi1 nutrienti
Grassi SaturiRiso Integrale più alto
Riso Integrale
0.24 g1% VG
Pera
0.01 g

Brown Rice (Cooked) provides 0.24 g vs 0.01 g in Pear (+0.23 g, +3900%).

Riepilogo del Confronto

Based on 26 nutrients analyzed, Brown Rice (Cooked) leads in 16 categories while Pear leads in 6.Both foods show similar concentrations in 4 nutrients. Overall, Riso Integrale has the nutritional edge in this comparison.

0 Alimenti
Confronta (0/2)