Side-by-Side Comparison

Pear vs Potato (Flesh & Skin, Baked)

Factual nutritional comparison based on verified food composition records.
Compare other foods
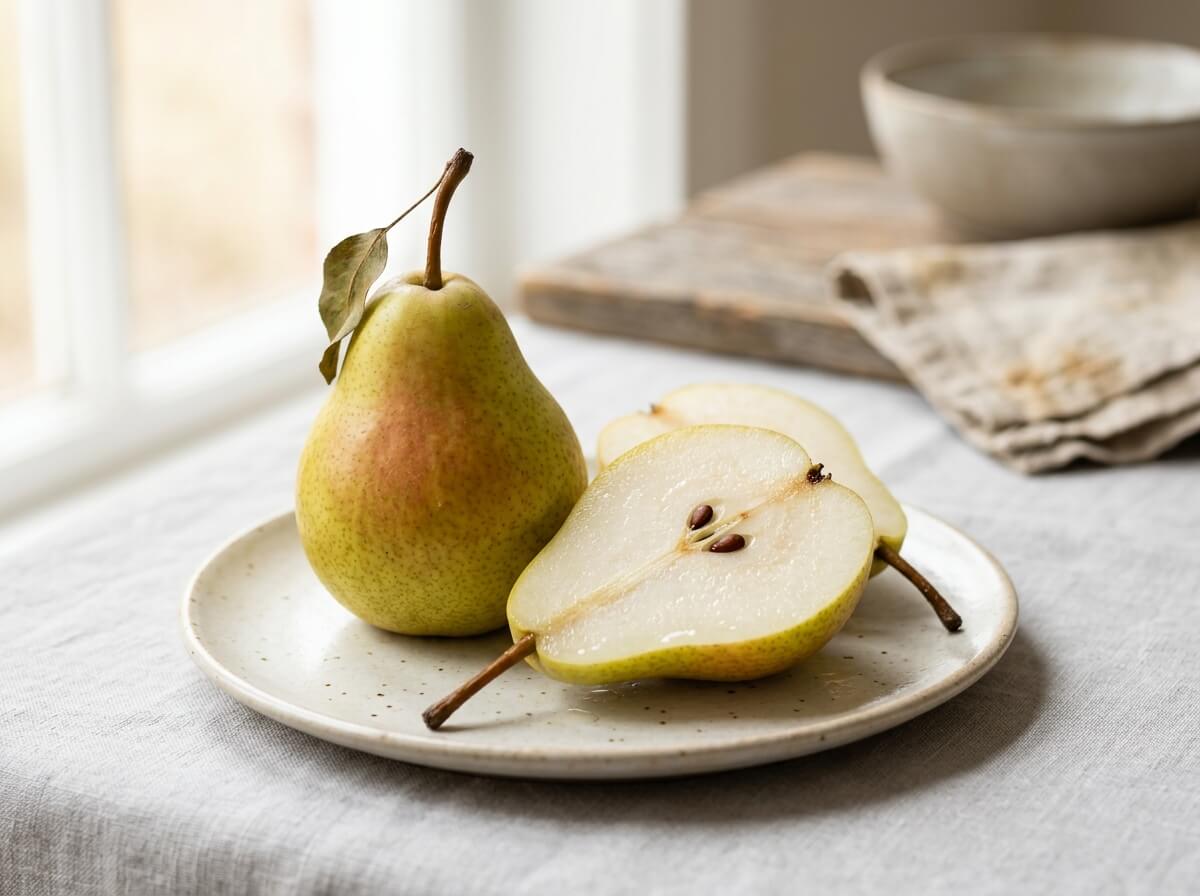
Fresh green Bartlett pear whole and sliced lengthwise on clean background
fruits

Pear

57Calories
0.4Protein
3.1Fiber
4.3Vit C
View Details
VS
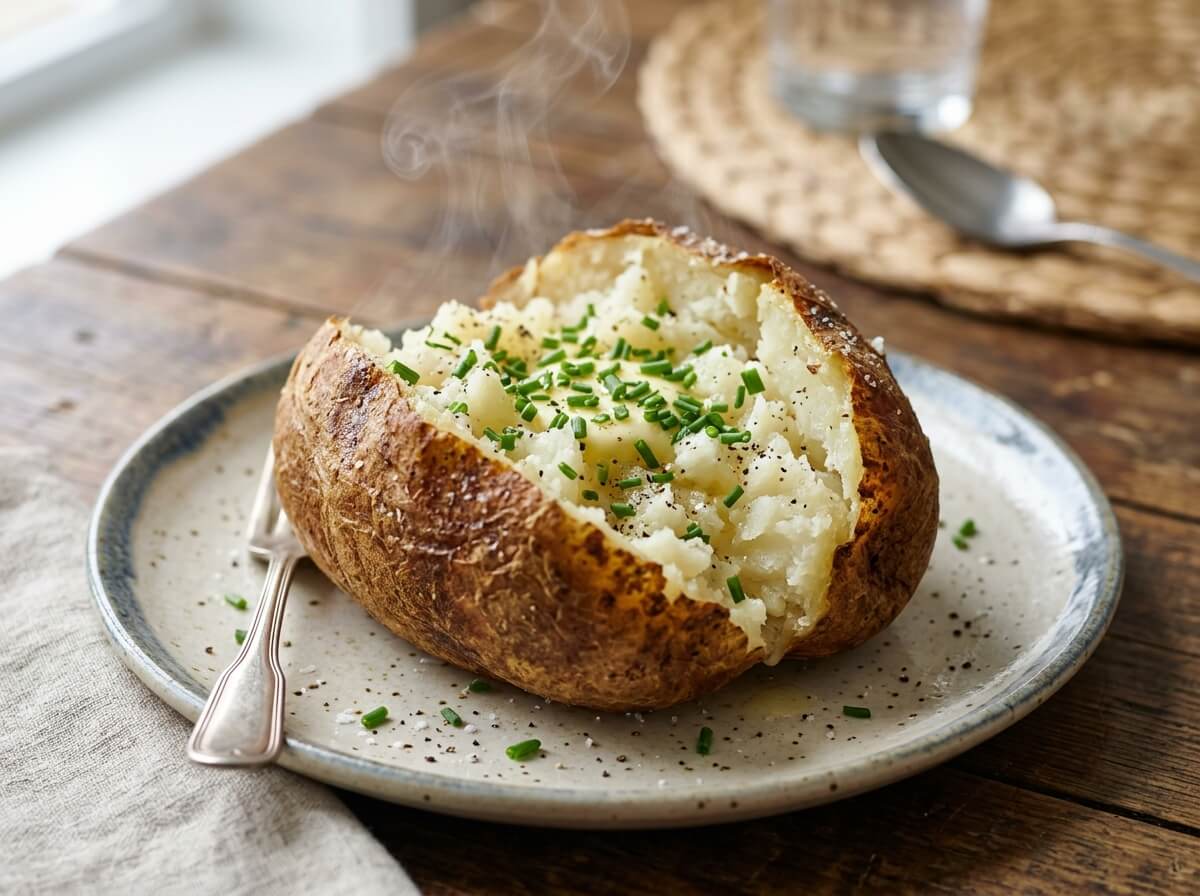
Clean baked potato cut open displaying fluffy steaming interior and skin
vegetables

Potato (Flesh & Skin, Baked)

93Calories
2.5Protein
2.2Fiber
12.8Vit C
View Details
Preparation State Notice

Comparing Pear (raw) with Potato (Flesh & Skin, Baked) (cooked). Moisture variations and cooking state affect nutrient concentrations.

Highlights

Nutritional Takeaways

Based on standard 100g edible portion comparison

Lower Calories
-39%
Pear

Pear has fewer calories (energy) (57 kcal vs 93 kcal, 36 kcal less).

Higher Protein
+594%
Potato (Flesh & Skin, Baked)

Potato (Flesh & Skin, Baked) provides 2.5 g vs 0.36 g in Pear (+2.1 g, +594%).

Higher Dietary Fiber
+41%
Pear

Pear provides 3.1 g vs 2.2 g in Potato (Flesh & Skin, Baked) (+0.90 g, +41%).

Higher Vitamin C
+198%
Potato (Flesh & Skin, Baked)

Potato (Flesh & Skin, Baked) provides 12.8 mg vs 4.3 mg in Pear (+8.5 mg, +198%).

Comparing per 100 g standard edible portion.

Nutrient
Pear100 g edible portion
Potato (Flesh & Skin, Baked)100 g edible portion
Macronutrients6 nutrients
Calories (Energy)Potato (Flesh & Skin, Baked) higher
Pear
57 kcal3% DV
Potato (Flesh & Skin, Baked)
93 kcal5% DV

Potato (Flesh & Skin, Baked) provides 93 kcal vs 57 kcal in Pear (+36 kcal, +63%).

ProteinPotato (Flesh & Skin, Baked) higher
Pear
0.36 g1% DV
Potato (Flesh & Skin, Baked)
2.5 g5% DV

Potato (Flesh & Skin, Baked) provides 2.5 g vs 0.36 g in Pear (+2.1 g, +594%).

CarbohydratesPotato (Flesh & Skin, Baked) higher
Pear
15.2 g6% DV
Potato (Flesh & Skin, Baked)
21.2 g8% DV

Potato (Flesh & Skin, Baked) provides 21.2 g vs 15.2 g in Pear (+5.9 g, +39%).

Dietary FiberPear higher
Pear
3.1 g11% DV
Potato (Flesh & Skin, Baked)
2.2 g8% DV

Pear provides 3.1 g vs 2.2 g in Potato (Flesh & Skin, Baked) (+0.90 g, +41%).

Total FatSimilar
Pear
0.14 g
Potato (Flesh & Skin, Baked)
0.13 g

Both Pear and Potato (Flesh & Skin, Baked) provide similar amounts of total fat (0.14 g).

Total SugarsPear higher
Pear
9.8 g20% DV
Potato (Flesh & Skin, Baked)
1.2 g2% DV

Pear provides 9.8 g vs 1.2 g in Potato (Flesh & Skin, Baked) (+8.6 g, +748%).

Vitamins12 nutrients
Vitamin CPotato (Flesh & Skin, Baked) higher
Pear
4.3 mg5% DV
Potato (Flesh & Skin, Baked)
12.8 mg14% DV

Potato (Flesh & Skin, Baked) provides 12.8 mg vs 4.3 mg in Pear (+8.5 mg, +198%).

Vitamin A (RAE)Pear higher
Pear
1.0 µg
Potato (Flesh & Skin, Baked)
0 µg

Pear has higher vitamin a (rae) (1.0 µg vs 0 µg).

Vitamin DSimilar
Pear
0 µg
Potato (Flesh & Skin, Baked)
0 µg

Both Pear and Potato (Flesh & Skin, Baked) provide similar amounts of vitamin d (0 µg).

Vitamin EPear higher
Pear
0.12 mg1% DV
Potato (Flesh & Skin, Baked)
0.05 mg

Pear provides slightly more vitamin e (0.12 mg vs 0.05 mg).

Vitamin KPear higher
Pear
4.4 µg4% DV
Potato (Flesh & Skin, Baked)
2.0 µg2% DV

Pear provides 4.4 µg vs 2.0 µg in Potato (Flesh & Skin, Baked) (+2.4 µg, +120%).

Folate (DFE)Potato (Flesh & Skin, Baked) higher
Pear
7.0 µg2% DV
Potato (Flesh & Skin, Baked)
28 µg7% DV

Potato (Flesh & Skin, Baked) provides 28 µg vs 7.0 µg in Pear (+21 µg, +300%).

Thiamin (Vitamin B1)Potato (Flesh & Skin, Baked) higher
Pear
0.01 mg1% DV
Potato (Flesh & Skin, Baked)
0.11 mg9% DV

Potato (Flesh & Skin, Baked) provides slightly more thiamin (vitamin b1) (0.11 mg vs 0.01 mg).

Riboflavin (Vitamin B2)Similar
Pear
0.03 mg2% DV
Potato (Flesh & Skin, Baked)
0.05 mg4% DV

Both Pear and Potato (Flesh & Skin, Baked) provide similar amounts of riboflavin (vitamin b2) (0.03 mg).

Niacin (Vitamin B3)Potato (Flesh & Skin, Baked) higher
Pear
0.16 mg1% DV
Potato (Flesh & Skin, Baked)
1.4 mg9% DV

Potato (Flesh & Skin, Baked) provides 1.4 mg vs 0.16 mg in Pear (+1.3 mg, +776%).

Pantothenic Acid (B5)Potato (Flesh & Skin, Baked) higher
Pear
0.05 mg1% DV
Potato (Flesh & Skin, Baked)
0.58 mg12% DV

Potato (Flesh & Skin, Baked) provides 0.58 mg vs 0.05 mg in Pear (+0.53 mg, +1092%).

Vitamin B6Potato (Flesh & Skin, Baked) higher
Pear
0.03 mg2% DV
Potato (Flesh & Skin, Baked)
0.30 mg18% DV

Potato (Flesh & Skin, Baked) provides 0.30 mg vs 0.03 mg in Pear (+0.27 mg, +928%).

Vitamin B12Similar
Pear
0 µg
Potato (Flesh & Skin, Baked)
0 µg

Both Pear and Potato (Flesh & Skin, Baked) provide similar amounts of vitamin b12 (0 µg).

Minerals7 nutrients
SodiumPotato (Flesh & Skin, Baked) higher
Pear
1.0 mg
Potato (Flesh & Skin, Baked)
10.0 mg

Potato (Flesh & Skin, Baked) provides 10.0 mg vs 1.0 mg in Pear (+9.0 mg, +900%).

PotassiumPotato (Flesh & Skin, Baked) higher
Pear
116 mg2% DV
Potato (Flesh & Skin, Baked)
535 mg11% DV

Potato (Flesh & Skin, Baked) provides 535 mg vs 116 mg in Pear (+419 mg, +361%).

CalciumPotato (Flesh & Skin, Baked) higher
Pear
9.0 mg1% DV
Potato (Flesh & Skin, Baked)
15.0 mg1% DV

Potato (Flesh & Skin, Baked) provides 15.0 mg vs 9.0 mg in Pear (+6.0 mg, +67%).

IronPotato (Flesh & Skin, Baked) higher
Pear
0.18 mg1% DV
Potato (Flesh & Skin, Baked)
1.1 mg6% DV

Potato (Flesh & Skin, Baked) provides 1.1 mg vs 0.18 mg in Pear (+0.90 mg, +500%).

MagnesiumPotato (Flesh & Skin, Baked) higher
Pear
7.0 mg2% DV
Potato (Flesh & Skin, Baked)
28.0 mg7% DV

Potato (Flesh & Skin, Baked) provides 28.0 mg vs 7.0 mg in Pear (+21.0 mg, +300%).

PhosphorusPotato (Flesh & Skin, Baked) higher
Pear
12.0 mg1% DV
Potato (Flesh & Skin, Baked)
70.0 mg6% DV

Potato (Flesh & Skin, Baked) provides 70.0 mg vs 12.0 mg in Pear (+58.0 mg, +483%).

ZincPotato (Flesh & Skin, Baked) higher
Pear
0.10 mg1% DV
Potato (Flesh & Skin, Baked)
0.36 mg3% DV

Potato (Flesh & Skin, Baked) provides 0.36 mg vs 0.10 mg in Pear (+0.26 mg, +260%).

Lipids1 nutrients
Saturated FatSimilar
Pear
0.01 g
Potato (Flesh & Skin, Baked)
0.03 g

Both Pear and Potato (Flesh & Skin, Baked) provide similar amounts of saturated fat (0.01 g).

Comparison Summary

Based on 26 nutrients analyzed, Pear leads in 5 categories while Potato (Flesh & Skin, Baked) leads in 16.Both foods show similar concentrations in 5 nutrients. Overall, Potato (Flesh & Skin, Baked) has the nutritional edge in this comparison.

0 Foods
Compare (0/2)