Pear vs White Rice (Cooked)
Factual nutritional comparison based on verified food composition records.
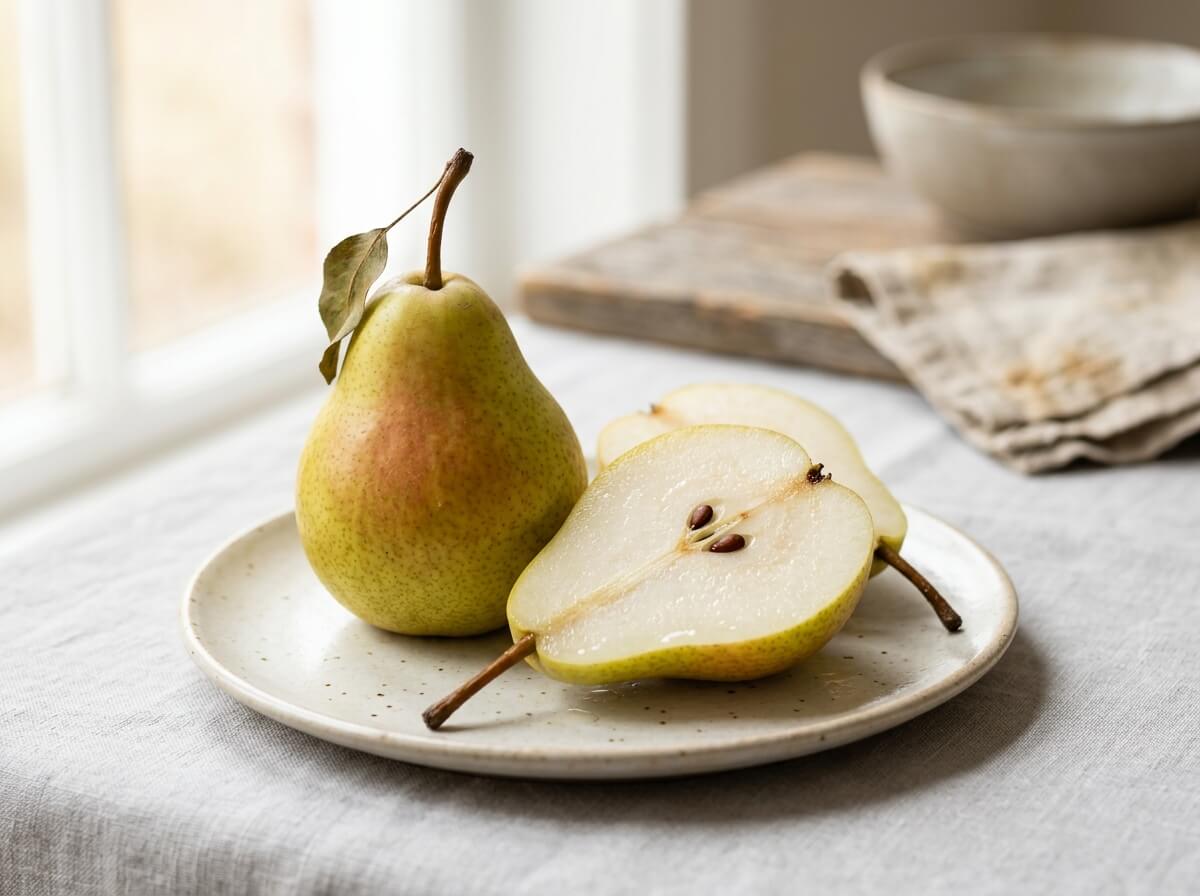
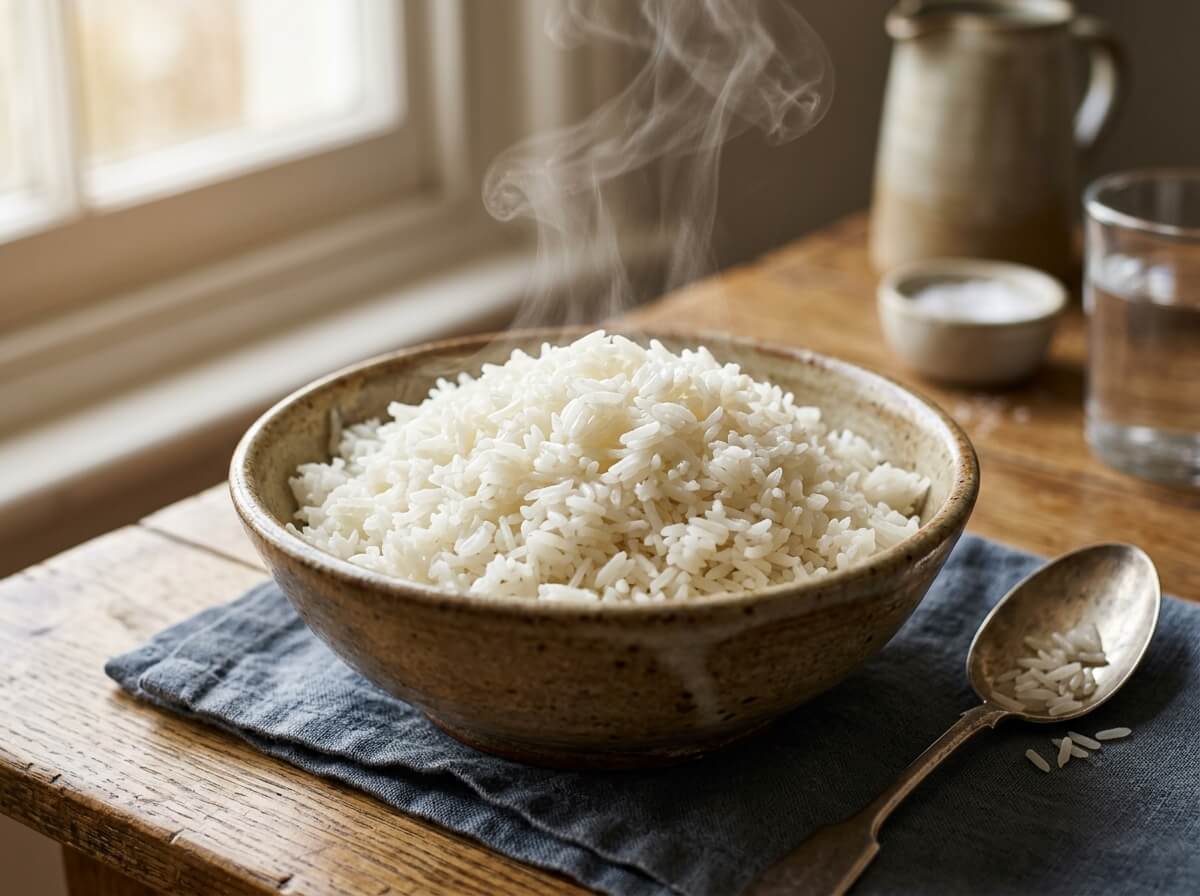
Nutritional Takeaways
Based on standard 100g edible portion comparison
Pear has fewer calories (energy) (57 kcal vs 130 kcal, 73 kcal less).
White Rice (Cooked) provides 2.7 g vs 0.36 g in Pear (+2.3 g, +647%).
Pear provides 3.1 g vs 0.40 g in White Rice (Cooked) (+2.7 g, +675%).
Pear provides 4.3 mg vs 0 mg in White Rice (Cooked) (+4.3 mg).
Macronutrients6 nutrients
White Rice (Cooked) provides 130 kcal vs 57 kcal in Pear (+73 kcal, +128%).
White Rice (Cooked) provides 2.7 g vs 0.36 g in Pear (+2.3 g, +647%).
White Rice (Cooked) provides 28.2 g vs 15.2 g in Pear (+12.9 g, +85%).
Pear provides 3.1 g vs 0.40 g in White Rice (Cooked) (+2.7 g, +675%).
White Rice (Cooked) provides 0.28 g vs 0.14 g in Pear (+0.14 g, +100%).
Pear provides 9.8 g vs 0.05 g in White Rice (Cooked) (+9.7 g, +19400%).
Vitamins12 nutrients
Pear has higher vitamin c (4.3 mg vs 0 mg).
Pear has higher vitamin a (rae) (1.0 µg vs 0 µg).
Both Pear and White Rice (Cooked) provide similar amounts of vitamin d (0 µg).
Pear provides slightly more vitamin e (0.12 mg vs 0.04 mg).
Pear provides 4.4 µg vs 0.1 µg in White Rice (Cooked) (+4.3 µg, +4300%).
White Rice (Cooked) provides 58 µg vs 7.0 µg in Pear (+51 µg, +729%).
White Rice (Cooked) provides slightly more thiamin (vitamin b1) (0.16 mg vs 0.01 mg).
Both Pear and White Rice (Cooked) provide similar amounts of riboflavin (vitamin b2) (0.03 mg).
White Rice (Cooked) provides 1.5 mg vs 0.16 mg in Pear (+1.3 mg, +817%).
White Rice (Cooked) provides 0.40 mg vs 0.05 mg in Pear (+0.35 mg, +706%).
White Rice (Cooked) provides slightly more vitamin b6 (0.09 mg vs 0.03 mg).
Both Pear and White Rice (Cooked) provide similar amounts of vitamin b12 (0 µg).
Minerals7 nutrients
Both Pear and White Rice (Cooked) provide similar amounts of sodium (1.0 mg).
Pear provides 116 mg vs 35.0 mg in White Rice (Cooked) (+81.0 mg, +231%).
White Rice (Cooked) provides 10.0 mg vs 9.0 mg in Pear (+1.0 mg, +11%).
White Rice (Cooked) provides 1.2 mg vs 0.18 mg in Pear (+1.0 mg, +567%).
White Rice (Cooked) provides 12.0 mg vs 7.0 mg in Pear (+5.0 mg, +71%).
White Rice (Cooked) provides 43.0 mg vs 12.0 mg in Pear (+31.0 mg, +258%).
White Rice (Cooked) provides 0.49 mg vs 0.10 mg in Pear (+0.39 mg, +390%).
Lipids1 nutrients
White Rice (Cooked) provides slightly more saturated fat (0.08 g vs 0.01 g).