Nährwerte im Vergleich

Mandeln vs Haferflocken

Wählen Sie zwei Lebensmittel und vergleichen Sie Makronährstoffe, Vitamine und Mineralstoffe Seite an Seite: pro 100g, pro Portion oder kalorienormalisiert.
Beliebte Vergleiche
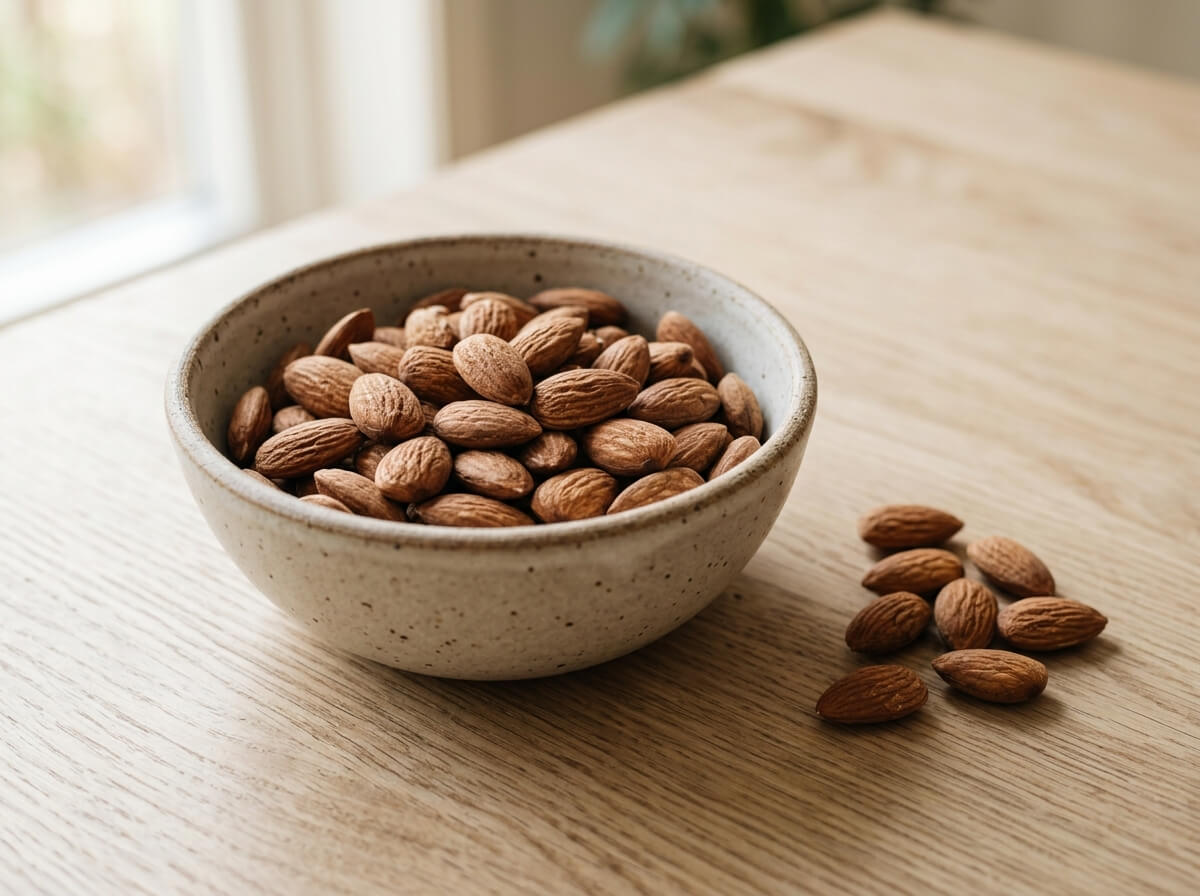
Clean raw whole almonds with natural brown skin in minimalist ceramic dish
Nüsse & Samen

Mandeln

579Kalorien
21.1Protein
12.5Ballaststoffe
0.0Vitamin C
Details anzeigen
VS
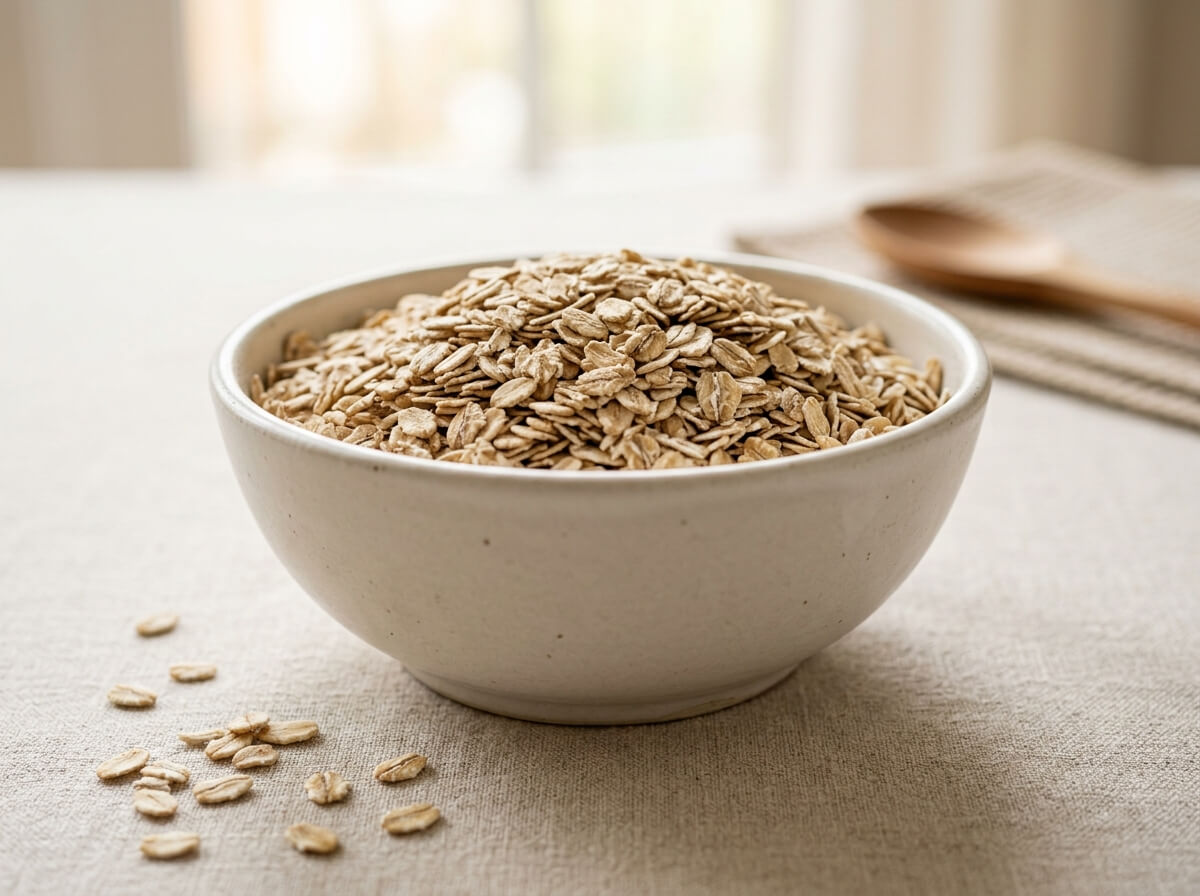
Clean whole rolled oats in a minimalist ceramic bowl
Getreide

Haferflocken

389Kalorien
16.9Protein
10.6Ballaststoffe
0.0Vitamin C
Details anzeigen
Highlights

Nutritional Takeaways

Based on standard 100g edible portion comparison

Weniger Kalorien
-33%
Haferflocken

Rolled Oats (Raw) has fewer calories (energy) (389 kcal vs 579 kcal, 190 kcal less).

Mehr Protein
+25%
Mandeln

Almonds (Raw) provides 21.2 g vs 16.9 g in Rolled Oats (Raw) (+4.3 g, +25%).

Mehr Ballaststoffe
+18%
Mandeln

Almonds (Raw) provides 12.5 g vs 10.6 g in Rolled Oats (Raw) (+1.9 g, +18%).

Mehr Kalium
+71%
Mandeln

Almonds (Raw) provides 733 mg vs 429 mg in Rolled Oats (Raw) (+304 mg, +71%).

Comparing per 100 g standard edible portion.

Nährstoff
Mandeln100 g edible portion
Haferflocken100 g edible portion
Makronährstoffe6 Nährstoffe
Kalorien (Energie)Mandeln höher
Mandeln
579 kcal29% TB
Haferflocken
389 kcal19% TB

Almonds (Raw) provides 579 kcal vs 389 kcal in Rolled Oats (Raw) (+190 kcal, +49%).

ProteinMandeln höher
Mandeln
21.2 g42% TB
Haferflocken
16.9 g34% TB

Almonds (Raw) provides 21.2 g vs 16.9 g in Rolled Oats (Raw) (+4.3 g, +25%).

KohlenhydrateHaferflocken höher
Mandeln
21.6 g8% TB
Haferflocken
66.3 g24% TB

Rolled Oats (Raw) provides 66.3 g vs 21.6 g in Almonds (Raw) (+44.7 g, +208%).

BallaststoffeMandeln höher
Mandeln
12.5 g45% TB
Haferflocken
10.6 g38% TB

Almonds (Raw) provides 12.5 g vs 10.6 g in Rolled Oats (Raw) (+1.9 g, +18%).

GesamtfettMandeln höher
Mandeln
49.9 g64% TB
Haferflocken
6.9 g9% TB

Almonds (Raw) provides 49.9 g vs 6.9 g in Rolled Oats (Raw) (+43.0 g, +624%).

ZuckerMandeln höher
Mandeln
4.4 g9% TB
Haferflocken
0.99 g2% TB

Almonds (Raw) provides 4.4 g vs 0.99 g in Rolled Oats (Raw) (+3.4 g, +339%).

Vitamine12 Nährstoffe
Vitamin CÄhnlich
Mandeln
0 mg
Haferflocken
0 mg

Both Almonds (Raw) and Rolled Oats (Raw) provide similar amounts of vitamin c (0 mg).

Vitamin AÄhnlich
Mandeln
0 µg
Haferflocken
0 µg

Both Almonds (Raw) and Rolled Oats (Raw) provide similar amounts of vitamin a (rae) (0 µg).

Vitamin DÄhnlich
Mandeln
0 µg
Haferflocken
0 µg

Both Almonds (Raw) and Rolled Oats (Raw) provide similar amounts of vitamin d (0 µg).

Vitamin EMandeln höher
Mandeln
25.6 mg171% TB
Haferflocken
0.42 mg3% TB

Almonds (Raw) provides 25.6 mg vs 0.42 mg in Rolled Oats (Raw) (+25.2 mg, +6002%).

Vitamin KHaferflocken höher
Mandeln
0 µg
Haferflocken
1.9 µg2% TB

Rolled Oats (Raw) has higher vitamin k (1.9 µg vs 0 µg).

FolsäureHaferflocken höher
Mandeln
44 µg11% TB
Haferflocken
56 µg14% TB

Rolled Oats (Raw) provides 56 µg vs 44 µg in Almonds (Raw) (+12 µg, +27%).

Vitamin B1 (Thiamin)Haferflocken höher
Mandeln
0.21 mg17% TB
Haferflocken
0.76 mg64% TB

Rolled Oats (Raw) provides 0.76 mg vs 0.21 mg in Almonds (Raw) (+0.56 mg, +272%).

Vitamin B2 (Riboflavin)Mandeln höher
Mandeln
1.1 mg88% TB
Haferflocken
0.14 mg11% TB

Almonds (Raw) provides 1.1 mg vs 0.14 mg in Rolled Oats (Raw) (+1.00 mg, +719%).

Vitamin B3 (Niacin)Mandeln höher
Mandeln
3.6 mg23% TB
Haferflocken
0.96 mg6% TB

Almonds (Raw) provides 3.6 mg vs 0.96 mg in Rolled Oats (Raw) (+2.7 mg, +276%).

Vitamin B5Haferflocken höher
Mandeln
0.47 mg9% TB
Haferflocken
1.3 mg27% TB

Rolled Oats (Raw) provides 1.3 mg vs 0.47 mg in Almonds (Raw) (+0.88 mg, +186%).

Vitamin B6Ähnlich
Mandeln
0.14 mg8% TB
Haferflocken
0.12 mg7% TB

Both Almonds (Raw) and Rolled Oats (Raw) provide similar amounts of vitamin b6 (0.14 mg).

Vitamin B12Ähnlich
Mandeln
0 µg
Haferflocken
0 µg

Both Almonds (Raw) and Rolled Oats (Raw) provide similar amounts of vitamin b12 (0 µg).

Mineralstoffe7 Nährstoffe
NatriumHaferflocken höher
Mandeln
1.0 mg
Haferflocken
2.0 mg

Rolled Oats (Raw) provides 2.0 mg vs 1.0 mg in Almonds (Raw) (+1.0 mg, +100%).

KaliumMandeln höher
Mandeln
733 mg16% TB
Haferflocken
429 mg9% TB

Almonds (Raw) provides 733 mg vs 429 mg in Rolled Oats (Raw) (+304 mg, +71%).

CalciumMandeln höher
Mandeln
269 mg21% TB
Haferflocken
54.0 mg4% TB

Almonds (Raw) provides 269 mg vs 54.0 mg in Rolled Oats (Raw) (+215 mg, +398%).

EisenHaferflocken höher
Mandeln
3.7 mg21% TB
Haferflocken
4.7 mg26% TB

Rolled Oats (Raw) provides 4.7 mg vs 3.7 mg in Almonds (Raw) (+1.0 mg, +27%).

MagnesiumMandeln höher
Mandeln
270 mg64% TB
Haferflocken
177 mg42% TB

Almonds (Raw) provides 270 mg vs 177 mg in Rolled Oats (Raw) (+93.0 mg, +53%).

PhosphorHaferflocken höher
Mandeln
481 mg38% TB
Haferflocken
523 mg42% TB

Rolled Oats (Raw) provides 523 mg vs 481 mg in Almonds (Raw) (+42.0 mg, +9%).

ZinkHaferflocken höher
Mandeln
3.1 mg28% TB
Haferflocken
4.0 mg36% TB

Rolled Oats (Raw) provides 4.0 mg vs 3.1 mg in Almonds (Raw) (+0.85 mg, +27%).

Lipide1 Nährstoffe
Gesättigte FettsäurenMandeln höher
Mandeln
3.8 g19% TB
Haferflocken
1.2 g6% TB

Almonds (Raw) provides 3.8 g vs 1.2 g in Rolled Oats (Raw) (+2.6 g, +211%).

Zusammenfassung des Vergleichs

Based on 26 nutrients analyzed, Almonds (Raw) leads in 12 categories while Rolled Oats (Raw) leads in 9.Both foods show similar concentrations in 5 nutrients. Overall, Mandeln has the nutritional edge in this comparison.

0 Lebensmittel
Vergleichen (0/2)