Nährwerte im Vergleich

Honigmelone vs Haferflocken

Wählen Sie zwei Lebensmittel und vergleichen Sie Makronährstoffe, Vitamine und Mineralstoffe Seite an Seite: pro 100g, pro Portion oder kalorienormalisiert.
Beliebte Vergleiche
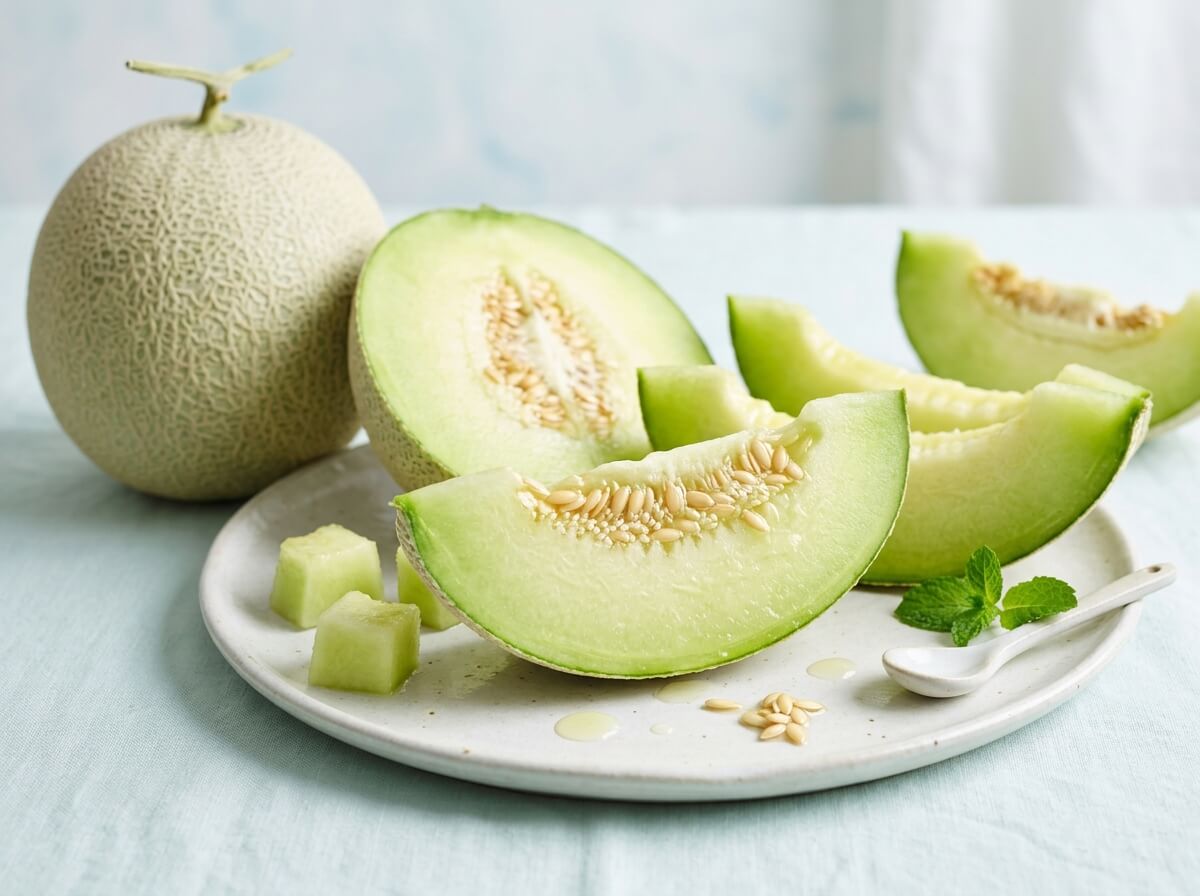
Fresh pale green honeydew melon sliced into wedges on neutral surface
Obst

Honigmelone

36Kalorien
0.5Protein
0.8Ballaststoffe
18.0Vitamin C
Details anzeigen
VS
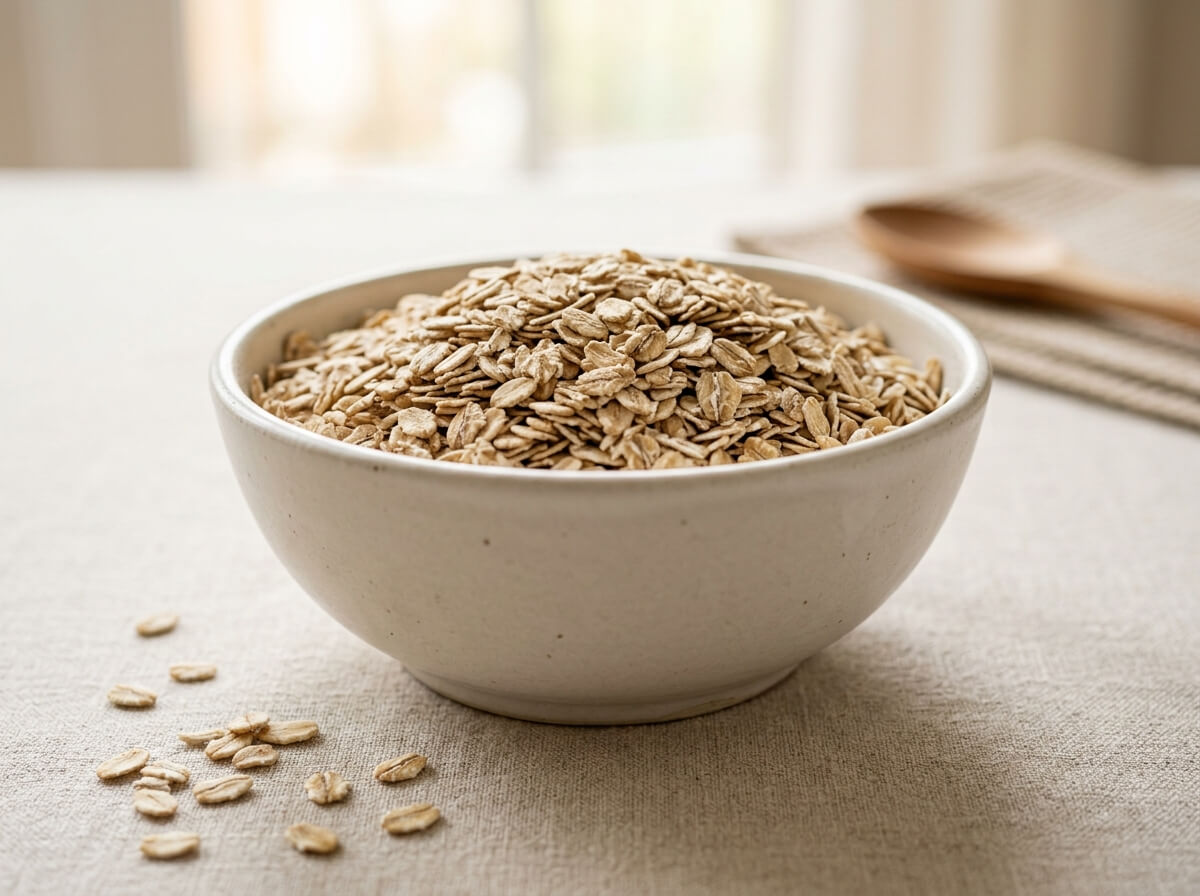
Clean whole rolled oats in a minimalist ceramic bowl
Getreide

Haferflocken

389Kalorien
16.9Protein
10.6Ballaststoffe
0.0Vitamin C
Details anzeigen
Highlights

Nutritional Takeaways

Based on standard 100g edible portion comparison

Weniger Kalorien
-91%
Honigmelone

Honeydew Melon has fewer calories (energy) (36 kcal vs 389 kcal, 353 kcal less).

Mehr Protein
+3028%
Haferflocken

Rolled Oats (Raw) provides 16.9 g vs 0.54 g in Honeydew Melon (+16.4 g, +3028%).

Mehr Ballaststoffe
+1225%
Haferflocken

Rolled Oats (Raw) provides 10.6 g vs 0.80 g in Honeydew Melon (+9.8 g, +1225%).

Mehr Vitamin C
Honigmelone

Honeydew Melon provides 18.0 mg vs 0 mg in Rolled Oats (Raw) (+18.0 mg).

Comparing per 100 g standard edible portion.

Nährstoff
Honigmelone100 g edible portion
Haferflocken100 g edible portion
Makronährstoffe6 Nährstoffe
Kalorien (Energie)Haferflocken höher
Honigmelone
36 kcal2% TB
Haferflocken
389 kcal19% TB

Rolled Oats (Raw) provides 389 kcal vs 36 kcal in Honeydew Melon (+353 kcal, +981%).

ProteinHaferflocken höher
Honigmelone
0.54 g1% TB
Haferflocken
16.9 g34% TB

Rolled Oats (Raw) provides 16.9 g vs 0.54 g in Honeydew Melon (+16.4 g, +3028%).

KohlenhydrateHaferflocken höher
Honigmelone
9.1 g3% TB
Haferflocken
66.3 g24% TB

Rolled Oats (Raw) provides 66.3 g vs 9.1 g in Honeydew Melon (+57.2 g, +629%).

BallaststoffeHaferflocken höher
Honigmelone
0.80 g3% TB
Haferflocken
10.6 g38% TB

Rolled Oats (Raw) provides 10.6 g vs 0.80 g in Honeydew Melon (+9.8 g, +1225%).

GesamtfettHaferflocken höher
Honigmelone
0.14 g
Haferflocken
6.9 g9% TB

Rolled Oats (Raw) provides 6.9 g vs 0.14 g in Honeydew Melon (+6.8 g, +4829%).

ZuckerHonigmelone höher
Honigmelone
8.1 g16% TB
Haferflocken
0.99 g2% TB

Honeydew Melon provides 8.1 g vs 0.99 g in Rolled Oats (Raw) (+7.1 g, +720%).

Vitamine12 Nährstoffe
Vitamin CHonigmelone höher
Honigmelone
18.0 mg20% TB
Haferflocken
0 mg

Honeydew Melon has higher vitamin c (18.0 mg vs 0 mg).

Vitamin AHonigmelone höher
Honigmelone
3.0 µg
Haferflocken
0 µg

Honeydew Melon has higher vitamin a (rae) (3.0 µg vs 0 µg).

Vitamin DÄhnlich
Honigmelone
0 µg
Haferflocken
0 µg

Both Honeydew Melon and Rolled Oats (Raw) provide similar amounts of vitamin d (0 µg).

Vitamin EHaferflocken höher
Honigmelone
0.02 mg
Haferflocken
0.42 mg3% TB

Rolled Oats (Raw) provides 0.42 mg vs 0.02 mg in Honeydew Melon (+0.40 mg, +2000%).

Vitamin KHonigmelone höher
Honigmelone
2.9 µg2% TB
Haferflocken
1.9 µg2% TB

Honeydew Melon provides 2.9 µg vs 1.9 µg in Rolled Oats (Raw) (+1.0 µg, +53%).

FolsäureHaferflocken höher
Honigmelone
19 µg5% TB
Haferflocken
56 µg14% TB

Rolled Oats (Raw) provides 56 µg vs 19 µg in Honeydew Melon (+37 µg, +195%).

Vitamin B1 (Thiamin)Haferflocken höher
Honigmelone
0.02 mg1% TB
Haferflocken
0.76 mg64% TB

Rolled Oats (Raw) provides 0.76 mg vs 0.02 mg in Honeydew Melon (+0.75 mg, +4987%).

Vitamin B2 (Riboflavin)Haferflocken höher
Honigmelone
0.01 mg1% TB
Haferflocken
0.14 mg11% TB

Rolled Oats (Raw) provides slightly more riboflavin (vitamin b2) (0.14 mg vs 0.01 mg).

Vitamin B3 (Niacin)Haferflocken höher
Honigmelone
0.42 mg3% TB
Haferflocken
0.96 mg6% TB

Rolled Oats (Raw) provides 0.96 mg vs 0.42 mg in Honeydew Melon (+0.54 mg, +130%).

Vitamin B5Haferflocken höher
Honigmelone
0.16 mg3% TB
Haferflocken
1.3 mg27% TB

Rolled Oats (Raw) provides 1.3 mg vs 0.16 mg in Honeydew Melon (+1.2 mg, +770%).

Vitamin B6Ähnlich
Honigmelone
0.09 mg5% TB
Haferflocken
0.12 mg7% TB

Both Honeydew Melon and Rolled Oats (Raw) provide similar amounts of vitamin b6 (0.09 mg).

Vitamin B12Ähnlich
Honigmelone
0 µg
Haferflocken
0 µg

Both Honeydew Melon and Rolled Oats (Raw) provide similar amounts of vitamin b12 (0 µg).

Mineralstoffe7 Nährstoffe
NatriumHonigmelone höher
Honigmelone
18.0 mg1% TB
Haferflocken
2.0 mg

Honeydew Melon provides 18.0 mg vs 2.0 mg in Rolled Oats (Raw) (+16.0 mg, +800%).

KaliumHaferflocken höher
Honigmelone
228 mg5% TB
Haferflocken
429 mg9% TB

Rolled Oats (Raw) provides 429 mg vs 228 mg in Honeydew Melon (+201 mg, +88%).

CalciumHaferflocken höher
Honigmelone
6.0 mg
Haferflocken
54.0 mg4% TB

Rolled Oats (Raw) provides 54.0 mg vs 6.0 mg in Honeydew Melon (+48.0 mg, +800%).

EisenHaferflocken höher
Honigmelone
0.17 mg1% TB
Haferflocken
4.7 mg26% TB

Rolled Oats (Raw) provides 4.7 mg vs 0.17 mg in Honeydew Melon (+4.6 mg, +2676%).

MagnesiumHaferflocken höher
Honigmelone
10.0 mg2% TB
Haferflocken
177 mg42% TB

Rolled Oats (Raw) provides 177 mg vs 10.0 mg in Honeydew Melon (+167 mg, +1670%).

PhosphorHaferflocken höher
Honigmelone
11.0 mg1% TB
Haferflocken
523 mg42% TB

Rolled Oats (Raw) provides 523 mg vs 11.0 mg in Honeydew Melon (+512 mg, +4655%).

ZinkHaferflocken höher
Honigmelone
0.09 mg1% TB
Haferflocken
4.0 mg36% TB

Rolled Oats (Raw) provides 4.0 mg vs 0.09 mg in Honeydew Melon (+3.9 mg, +4311%).

Lipide1 Nährstoffe
Gesättigte FettsäurenHaferflocken höher
Honigmelone
0.04 g
Haferflocken
1.2 g6% TB

Rolled Oats (Raw) provides 1.2 g vs 0.04 g in Honeydew Melon (+1.2 g, +3111%).

Zusammenfassung des Vergleichs

Based on 26 nutrients analyzed, Honeydew Melon leads in 5 categories while Rolled Oats (Raw) leads in 18.Both foods show similar concentrations in 3 nutrients. Overall, Haferflocken has the nutritional edge in this comparison.

0 Lebensmittel
Vergleichen (0/2)