Nährwerte im Vergleich

Pflaumen vs Quinoa

Wählen Sie zwei Lebensmittel und vergleichen Sie Makronährstoffe, Vitamine und Mineralstoffe Seite an Seite: pro 100g, pro Portion oder kalorienormalisiert.
Beliebte Vergleiche
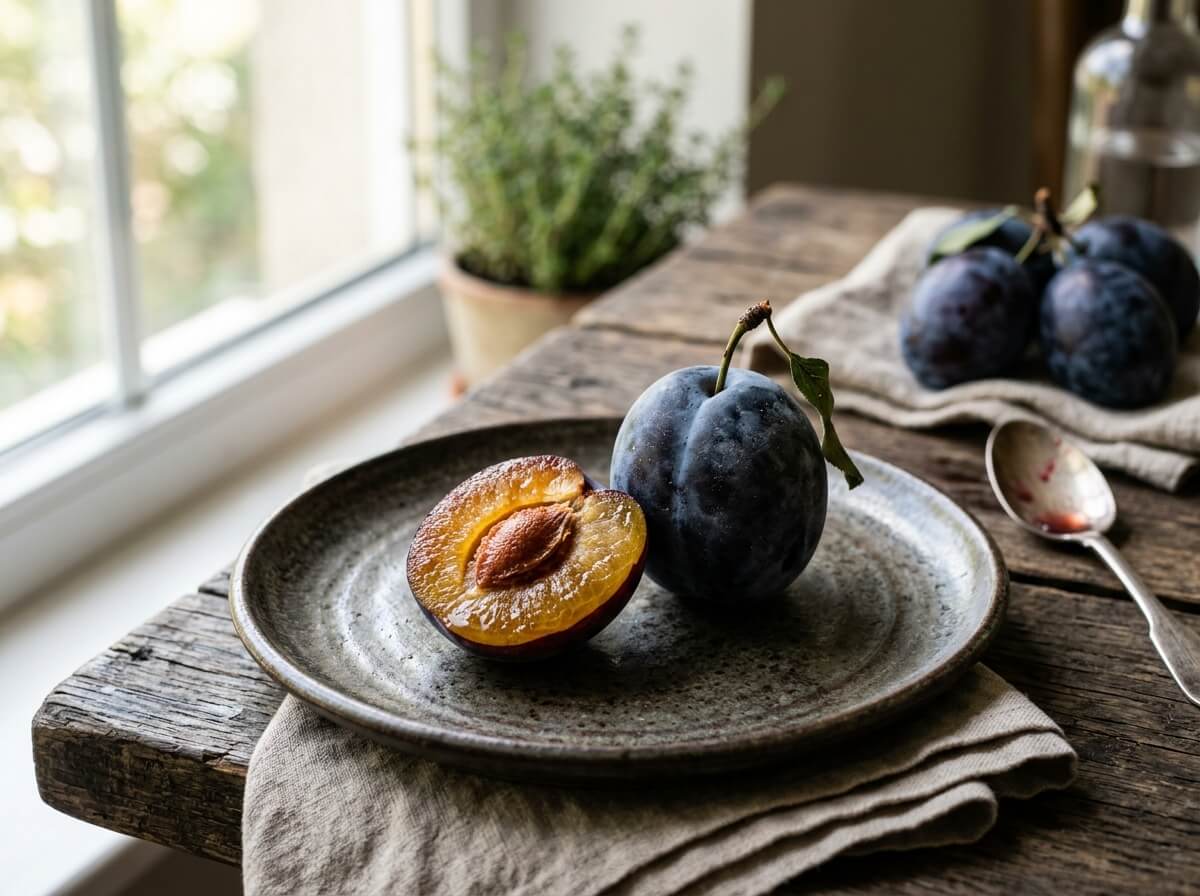
Fresh deep purple plums with one sliced in half displaying amber flesh
Obst

Pflaumen

46Kalorien
0.7Protein
1.4Ballaststoffe
9.5Vitamin C
Details anzeigen
VS
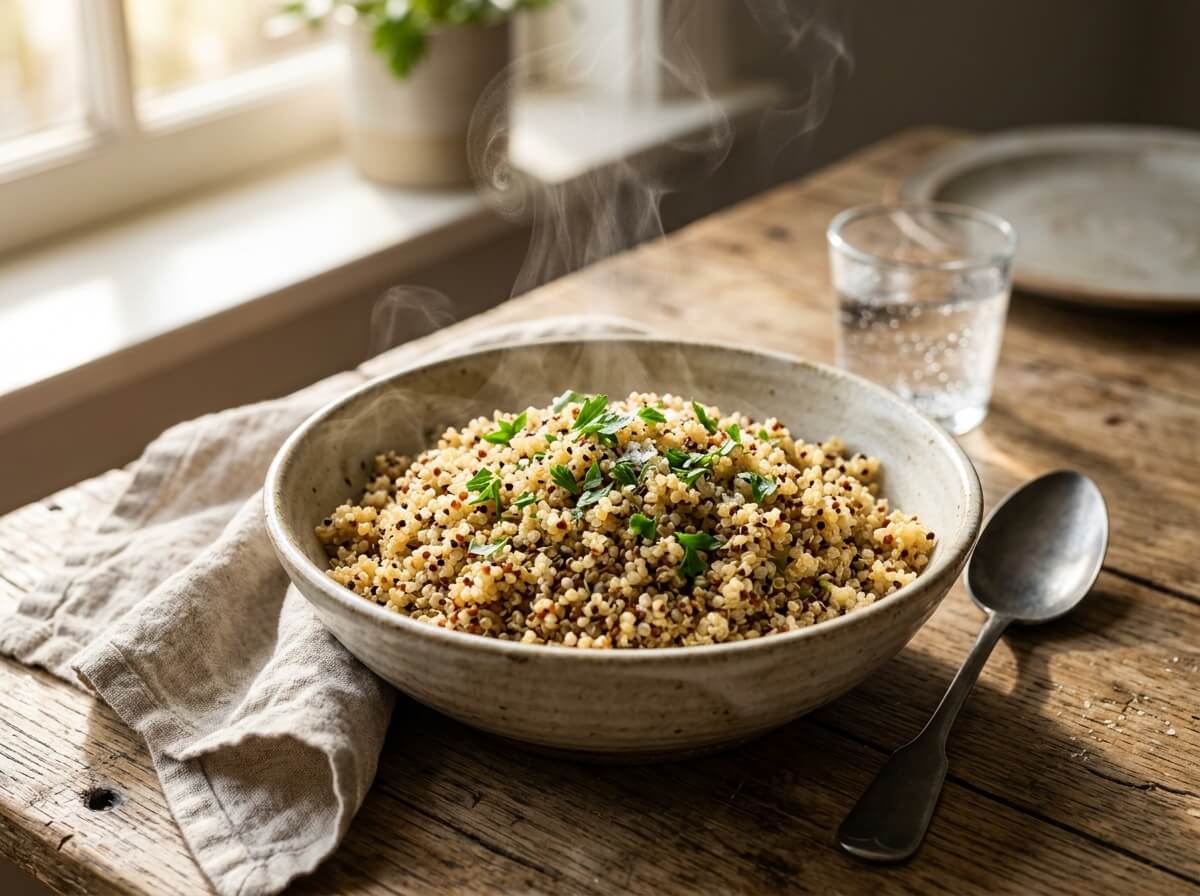
Fluffy cooked quinoa showing tiny light spiraled germ rings
Getreide

Quinoa

120Kalorien
4.4Protein
2.8Ballaststoffe
0.0Vitamin C
Details anzeigen
Preparation State Notice

Comparing Plums (raw) with Quinoa (Cooked) (cooked). Moisture variations and cooking state affect nutrient concentrations.

Highlights

Nutritional Takeaways

Based on standard 100g edible portion comparison

Weniger Kalorien
-62%
Pflaumen

Plums has fewer calories (energy) (46 kcal vs 120 kcal, 74 kcal less).

Mehr Protein
+529%
Quinoa

Quinoa (Cooked) provides 4.4 g vs 0.70 g in Plums (+3.7 g, +529%).

Mehr Ballaststoffe
+100%
Quinoa

Quinoa (Cooked) provides 2.8 g vs 1.4 g in Plums (+1.4 g, +100%).

Mehr Vitamin C
Pflaumen

Plums provides 9.5 mg vs 0 mg in Quinoa (Cooked) (+9.5 mg).

Comparing per 100 g standard edible portion.

Nährstoff
Pflaumen100 g edible portion
Quinoa100 g edible portion
Makronährstoffe6 Nährstoffe
Kalorien (Energie)Quinoa höher
Pflaumen
46 kcal2% TB
Quinoa
120 kcal6% TB

Quinoa (Cooked) provides 120 kcal vs 46 kcal in Plums (+74 kcal, +161%).

ProteinQuinoa höher
Pflaumen
0.70 g1% TB
Quinoa
4.4 g9% TB

Quinoa (Cooked) provides 4.4 g vs 0.70 g in Plums (+3.7 g, +529%).

KohlenhydrateQuinoa höher
Pflaumen
11.4 g4% TB
Quinoa
21.3 g8% TB

Quinoa (Cooked) provides 21.3 g vs 11.4 g in Plums (+9.9 g, +87%).

BallaststoffeQuinoa höher
Pflaumen
1.4 g5% TB
Quinoa
2.8 g10% TB

Quinoa (Cooked) provides 2.8 g vs 1.4 g in Plums (+1.4 g, +100%).

GesamtfettQuinoa höher
Pflaumen
0.28 g
Quinoa
1.9 g2% TB

Quinoa (Cooked) provides 1.9 g vs 0.28 g in Plums (+1.6 g, +586%).

ZuckerPflaumen höher
Pflaumen
9.9 g20% TB
Quinoa
0.87 g2% TB

Plums provides 9.9 g vs 0.87 g in Quinoa (Cooked) (+9.1 g, +1040%).

Vitamine12 Nährstoffe
Vitamin CPflaumen höher
Pflaumen
9.5 mg11% TB
Quinoa
0 mg

Plums has higher vitamin c (9.5 mg vs 0 mg).

Vitamin APflaumen höher
Pflaumen
17 µg2% TB
Quinoa
1.0 µg

Plums provides 17 µg vs 1.0 µg in Quinoa (Cooked) (+16 µg, +1600%).

Vitamin DÄhnlich
Pflaumen
0 µg
Quinoa
0 µg

Both Plums and Quinoa (Cooked) provide similar amounts of vitamin d (0 µg).

Vitamin EQuinoa höher
Pflaumen
0.26 mg2% TB
Quinoa
0.63 mg4% TB

Quinoa (Cooked) provides 0.63 mg vs 0.26 mg in Plums (+0.37 mg, +142%).

Vitamin KPflaumen höher
Pflaumen
6.4 µg5% TB
Quinoa
0 µg

Plums has higher vitamin k (6.4 µg vs 0 µg).

FolsäureQuinoa höher
Pflaumen
5.0 µg1% TB
Quinoa
42 µg11% TB

Quinoa (Cooked) provides 42 µg vs 5.0 µg in Plums (+37 µg, +740%).

Vitamin B1 (Thiamin)Quinoa höher
Pflaumen
0.03 mg2% TB
Quinoa
0.11 mg9% TB

Quinoa (Cooked) provides slightly more thiamin (vitamin b1) (0.11 mg vs 0.03 mg).

Vitamin B2 (Riboflavin)Quinoa höher
Pflaumen
0.03 mg2% TB
Quinoa
0.11 mg8% TB

Quinoa (Cooked) provides slightly more riboflavin (vitamin b2) (0.11 mg vs 0.03 mg).

Vitamin B3 (Niacin)Ähnlich
Pflaumen
0.42 mg3% TB
Quinoa
0.41 mg3% TB

Both Plums and Quinoa (Cooked) provide similar amounts of niacin (vitamin b3) (0.42 mg).

Vitamin B5Quinoa höher
Pflaumen
0.14 mg3% TB
Quinoa
0.23 mg5% TB

Quinoa (Cooked) provides 0.23 mg vs 0.14 mg in Plums (+0.09 mg, +69%).

Vitamin B6Quinoa höher
Pflaumen
0.03 mg2% TB
Quinoa
0.12 mg7% TB

Quinoa (Cooked) provides slightly more vitamin b6 (0.12 mg vs 0.03 mg).

Vitamin B12Ähnlich
Pflaumen
0 µg
Quinoa
0 µg

Both Plums and Quinoa (Cooked) provide similar amounts of vitamin b12 (0 µg).

Mineralstoffe7 Nährstoffe
NatriumQuinoa höher
Pflaumen
0 mg
Quinoa
7.0 mg

Quinoa (Cooked) has higher sodium (7.0 mg vs 0 mg).

KaliumQuinoa höher
Pflaumen
157 mg3% TB
Quinoa
172 mg4% TB

Quinoa (Cooked) provides 172 mg vs 157 mg in Plums (+15.0 mg, +10%).

CalciumQuinoa höher
Pflaumen
6.0 mg
Quinoa
17.0 mg1% TB

Quinoa (Cooked) provides 17.0 mg vs 6.0 mg in Plums (+11.0 mg, +183%).

EisenQuinoa höher
Pflaumen
0.17 mg1% TB
Quinoa
1.5 mg8% TB

Quinoa (Cooked) provides 1.5 mg vs 0.17 mg in Plums (+1.3 mg, +776%).

MagnesiumQuinoa höher
Pflaumen
7.0 mg2% TB
Quinoa
64.0 mg15% TB

Quinoa (Cooked) provides 64.0 mg vs 7.0 mg in Plums (+57.0 mg, +814%).

PhosphorQuinoa höher
Pflaumen
16.0 mg1% TB
Quinoa
152 mg12% TB

Quinoa (Cooked) provides 152 mg vs 16.0 mg in Plums (+136 mg, +850%).

ZinkQuinoa höher
Pflaumen
0.10 mg1% TB
Quinoa
1.1 mg10% TB

Quinoa (Cooked) provides 1.1 mg vs 0.10 mg in Plums (+0.99 mg, +990%).

Lipide1 Nährstoffe
Gesättigte FettsäurenQuinoa höher
Pflaumen
0.02 g
Quinoa
0.23 g1% TB

Quinoa (Cooked) provides 0.23 g vs 0.02 g in Plums (+0.21 g, +1253%).

Zusammenfassung des Vergleichs

Based on 26 nutrients analyzed, Plums leads in 4 categories while Quinoa (Cooked) leads in 19.Both foods show similar concentrations in 3 nutrients. Overall, Quinoa has the nutritional edge in this comparison.

0 Lebensmittel
Vergleichen (0/2)