Brombeeren vs Lachs
Wählen Sie zwei Lebensmittel und vergleichen Sie Makronährstoffe, Vitamine und Mineralstoffe Seite an Seite: pro 100g, pro Portion oder kalorienormalisiert.
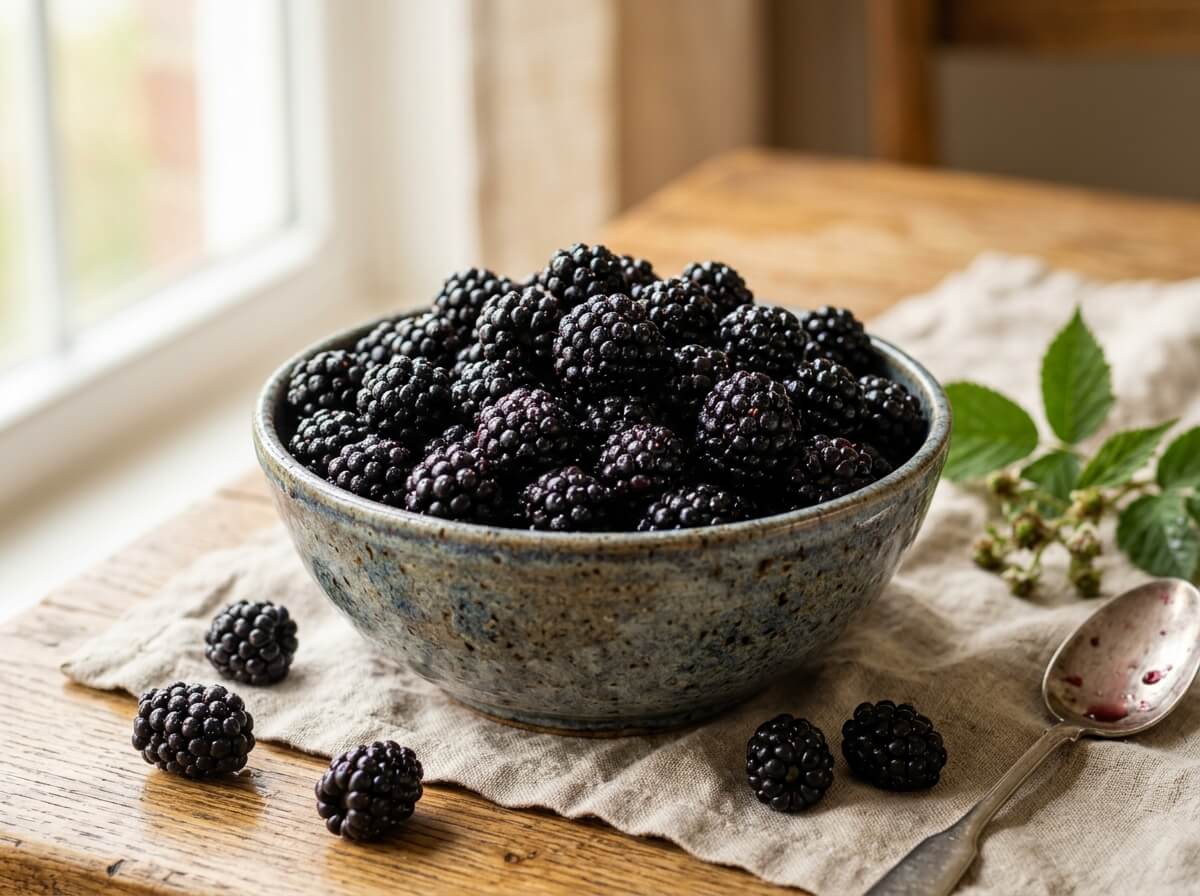
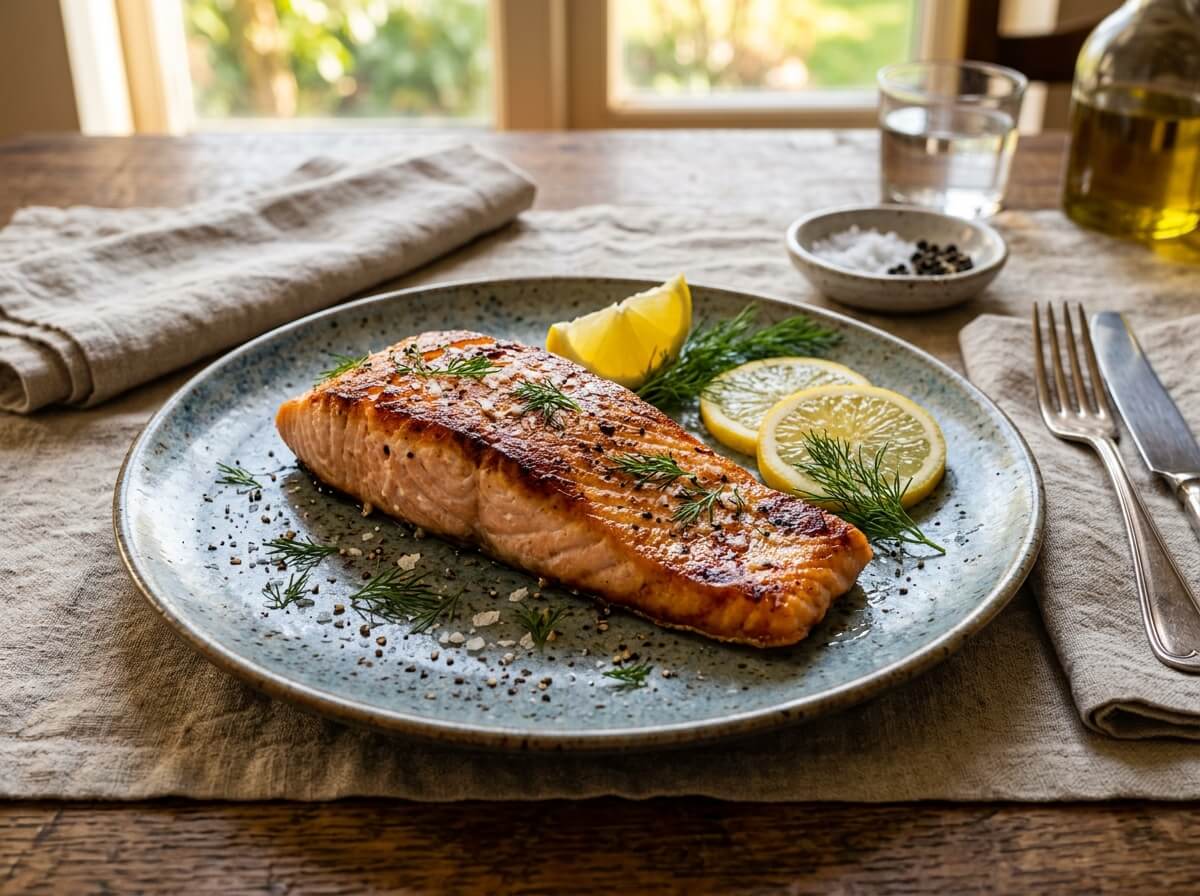
Nutritional Takeaways
Based on standard 100g edible portion comparison
Blackberries has fewer calories (energy) (43 kcal vs 206 kcal, 163 kcal less).
Atlantic Salmon (Cooked/Baked) provides 22.1 g vs 1.4 g in Blackberries (+20.7 g, +1490%).
Blackberries provides 5.3 g vs 0 g in Atlantic Salmon (Cooked/Baked) (+5.3 g).
Blackberries provides 21.0 mg vs 0 mg in Atlantic Salmon (Cooked/Baked) (+21.0 mg).
Makronährstoffe6 Nährstoffe
Atlantic Salmon (Cooked/Baked) provides 206 kcal vs 43 kcal in Blackberries (+163 kcal, +379%).
Atlantic Salmon (Cooked/Baked) provides 22.1 g vs 1.4 g in Blackberries (+20.7 g, +1490%).
Blackberries has higher carbohydrates (9.6 g vs 0 g).
Blackberries has higher dietary fiber (5.3 g vs 0 g).
Atlantic Salmon (Cooked/Baked) provides 12.4 g vs 0.49 g in Blackberries (+11.9 g, +2420%).
Blackberries has higher total sugars (4.9 g vs 0 g).
Vitamine12 Nährstoffe
Blackberries has higher vitamin c (21.0 mg vs 0 mg).
Atlantic Salmon (Cooked/Baked) provides 12 µg vs 11 µg in Blackberries (+1.0 µg, +9%).
Atlantic Salmon (Cooked/Baked) has higher vitamin d (11 µg vs 0 µg).
Atlantic Salmon (Cooked/Baked) provides 3.6 mg vs 1.2 mg in Blackberries (+2.4 mg, +203%).
Blackberries provides 20 µg vs 0.1 µg in Atlantic Salmon (Cooked/Baked) (+20 µg, +19700%).
Atlantic Salmon (Cooked/Baked) provides 29 µg vs 25 µg in Blackberries (+4.0 µg, +16%).
Atlantic Salmon (Cooked/Baked) provides 0.23 mg vs 0.02 mg in Blackberries (+0.21 mg, +1030%).
Atlantic Salmon (Cooked/Baked) provides slightly more riboflavin (vitamin b2) (0.14 mg vs 0.03 mg).
Atlantic Salmon (Cooked/Baked) provides 8.7 mg vs 0.65 mg in Blackberries (+8.0 mg, +1239%).
Atlantic Salmon (Cooked/Baked) provides 1.7 mg vs 0.28 mg in Blackberries (+1.4 mg, +501%).
Atlantic Salmon (Cooked/Baked) provides 0.64 mg vs 0.03 mg in Blackberries (+0.61 mg, +2033%).
Atlantic Salmon (Cooked/Baked) has higher vitamin b12 (3.2 µg vs 0 µg).
Mineralstoffe7 Nährstoffe
Atlantic Salmon (Cooked/Baked) provides 60.0 mg vs 1.0 mg in Blackberries (+59.0 mg, +5900%).
Atlantic Salmon (Cooked/Baked) provides 384 mg vs 162 mg in Blackberries (+222 mg, +137%).
Blackberries provides 29.0 mg vs 12.0 mg in Atlantic Salmon (Cooked/Baked) (+17.0 mg, +142%).
Atlantic Salmon (Cooked/Baked) provides 0.80 mg vs 0.62 mg in Blackberries (+0.18 mg, +29%).
Atlantic Salmon (Cooked/Baked) provides 30.0 mg vs 20.0 mg in Blackberries (+10.0 mg, +50%).
Atlantic Salmon (Cooked/Baked) provides 252 mg vs 22.0 mg in Blackberries (+230 mg, +1045%).
Atlantic Salmon (Cooked/Baked) provides 0.64 mg vs 0.53 mg in Blackberries (+0.11 mg, +21%).
Lipide1 Nährstoffe
Atlantic Salmon (Cooked/Baked) provides 2.5 g vs 0.01 g in Blackberries (+2.5 g, +17757%).