Haferflocken vs Lachs
Wählen Sie zwei Lebensmittel und vergleichen Sie Makronährstoffe, Vitamine und Mineralstoffe Seite an Seite: pro 100g, pro Portion oder kalorienormalisiert.
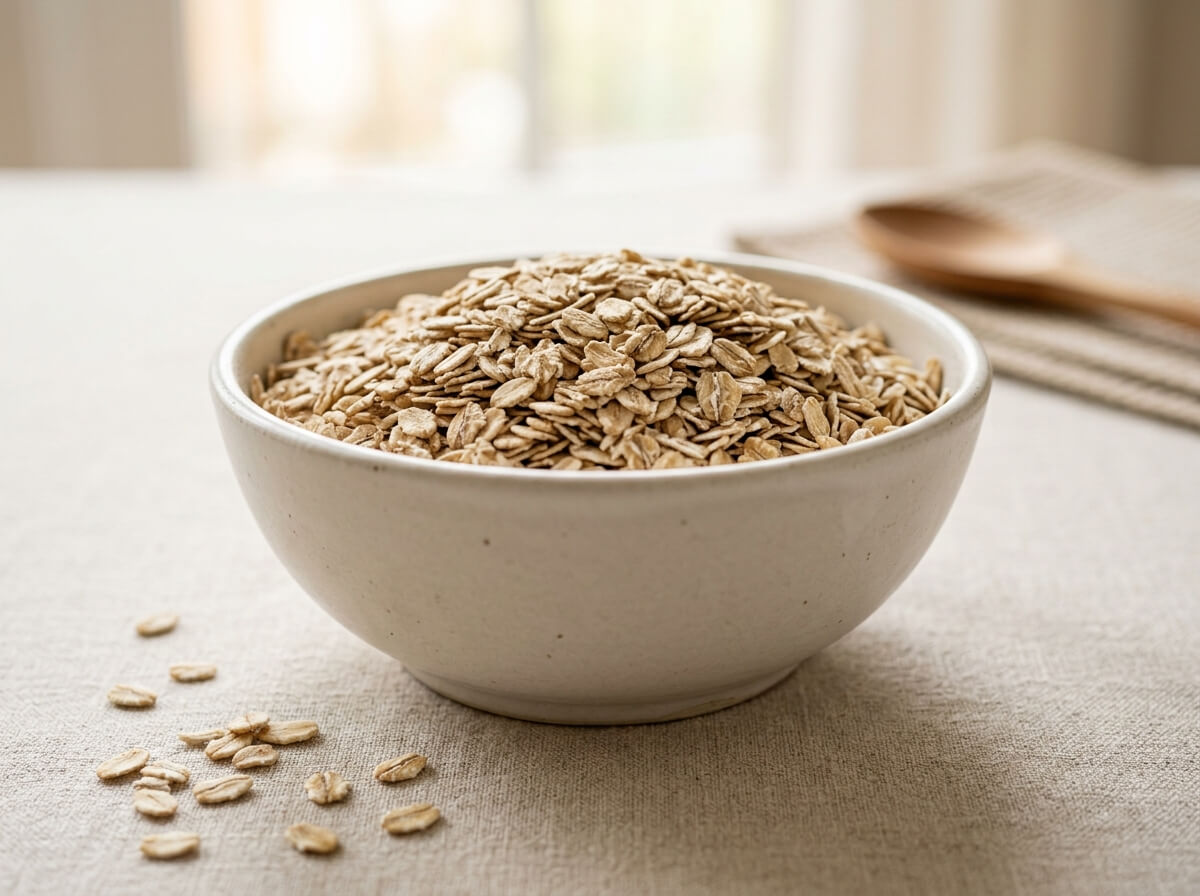
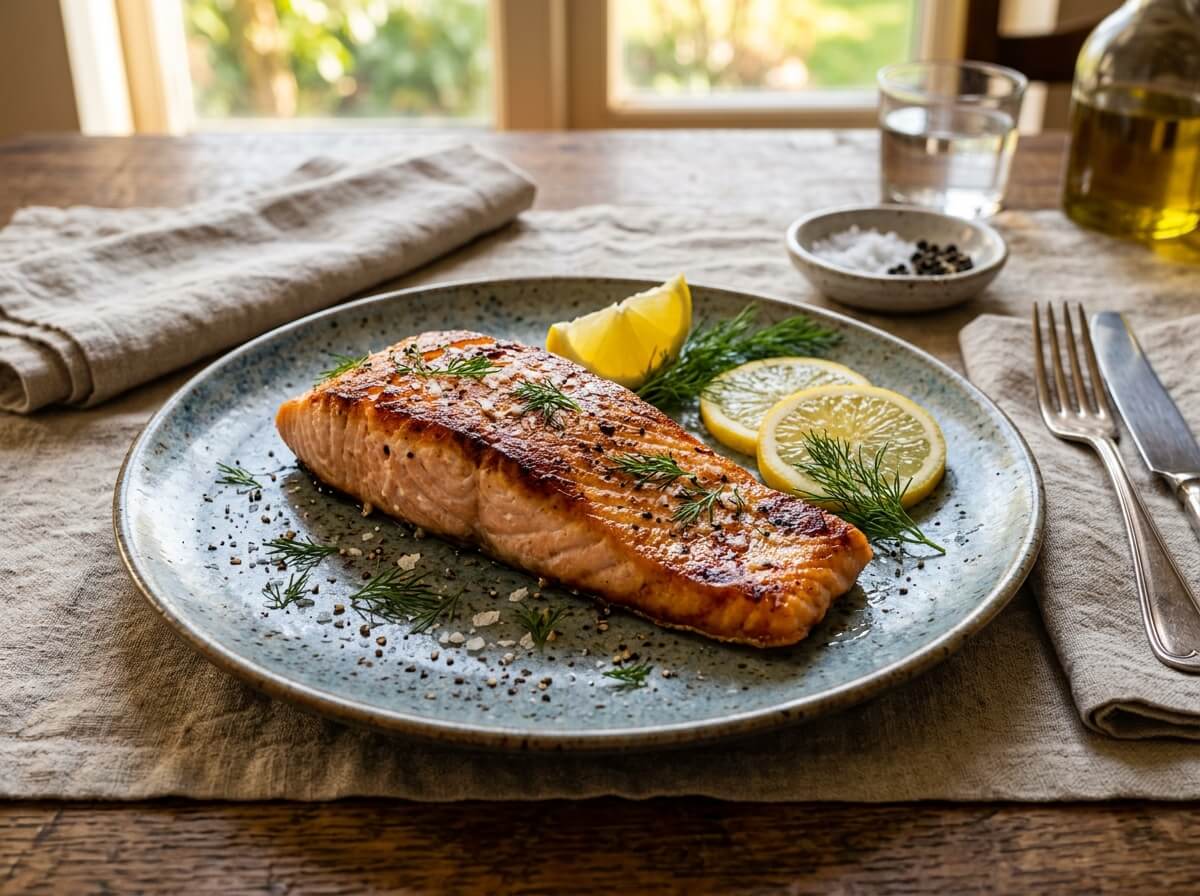
Nutritional Takeaways
Based on standard 100g edible portion comparison
Atlantic Salmon (Cooked/Baked) has fewer calories (energy) (206 kcal vs 389 kcal, 183 kcal less).
Atlantic Salmon (Cooked/Baked) provides 22.1 g vs 16.9 g in Rolled Oats (Raw) (+5.2 g, +31%).
Rolled Oats (Raw) provides 10.6 g vs 0 g in Atlantic Salmon (Cooked/Baked) (+10.6 g).
Rolled Oats (Raw) provides 429 mg vs 384 mg in Atlantic Salmon (Cooked/Baked) (+45.0 mg, +12%).
Makronährstoffe6 Nährstoffe
Rolled Oats (Raw) provides 389 kcal vs 206 kcal in Atlantic Salmon (Cooked/Baked) (+183 kcal, +89%).
Atlantic Salmon (Cooked/Baked) provides 22.1 g vs 16.9 g in Rolled Oats (Raw) (+5.2 g, +31%).
Rolled Oats (Raw) has higher carbohydrates (66.3 g vs 0 g).
Rolled Oats (Raw) has higher dietary fiber (10.6 g vs 0 g).
Atlantic Salmon (Cooked/Baked) provides 12.4 g vs 6.9 g in Rolled Oats (Raw) (+5.4 g, +79%).
Rolled Oats (Raw) has higher total sugars (0.99 g vs 0 g).
Vitamine12 Nährstoffe
Both Rolled Oats (Raw) and Atlantic Salmon (Cooked/Baked) provide similar amounts of vitamin c (0 mg).
Atlantic Salmon (Cooked/Baked) has higher vitamin a (rae) (12 µg vs 0 µg).
Atlantic Salmon (Cooked/Baked) has higher vitamin d (11 µg vs 0 µg).
Atlantic Salmon (Cooked/Baked) provides 3.6 mg vs 0.42 mg in Rolled Oats (Raw) (+3.1 mg, +745%).
Rolled Oats (Raw) provides 1.9 µg vs 0.1 µg in Atlantic Salmon (Cooked/Baked) (+1.8 µg, +1800%).
Rolled Oats (Raw) provides 56 µg vs 29 µg in Atlantic Salmon (Cooked/Baked) (+27 µg, +93%).
Rolled Oats (Raw) provides 0.76 mg vs 0.23 mg in Atlantic Salmon (Cooked/Baked) (+0.54 mg, +238%).
Both Rolled Oats (Raw) and Atlantic Salmon (Cooked/Baked) provide similar amounts of riboflavin (vitamin b2) (0.14 mg).
Atlantic Salmon (Cooked/Baked) provides 8.7 mg vs 0.96 mg in Rolled Oats (Raw) (+7.7 mg, +800%).
Atlantic Salmon (Cooked/Baked) provides 1.7 mg vs 1.3 mg in Rolled Oats (Raw) (+0.31 mg, +23%).
Atlantic Salmon (Cooked/Baked) provides 0.64 mg vs 0.12 mg in Rolled Oats (Raw) (+0.52 mg, +438%).
Atlantic Salmon (Cooked/Baked) has higher vitamin b12 (3.2 µg vs 0 µg).
Mineralstoffe7 Nährstoffe
Atlantic Salmon (Cooked/Baked) provides 60.0 mg vs 2.0 mg in Rolled Oats (Raw) (+58.0 mg, +2900%).
Rolled Oats (Raw) provides 429 mg vs 384 mg in Atlantic Salmon (Cooked/Baked) (+45.0 mg, +12%).
Rolled Oats (Raw) provides 54.0 mg vs 12.0 mg in Atlantic Salmon (Cooked/Baked) (+42.0 mg, +350%).
Rolled Oats (Raw) provides 4.7 mg vs 0.80 mg in Atlantic Salmon (Cooked/Baked) (+3.9 mg, +490%).
Rolled Oats (Raw) provides 177 mg vs 30.0 mg in Atlantic Salmon (Cooked/Baked) (+147 mg, +490%).
Rolled Oats (Raw) provides 523 mg vs 252 mg in Atlantic Salmon (Cooked/Baked) (+271 mg, +108%).
Rolled Oats (Raw) provides 4.0 mg vs 0.64 mg in Atlantic Salmon (Cooked/Baked) (+3.3 mg, +520%).
Lipide1 Nährstoffe
Atlantic Salmon (Cooked/Baked) provides 2.5 g vs 1.2 g in Rolled Oats (Raw) (+1.3 g, +105%).