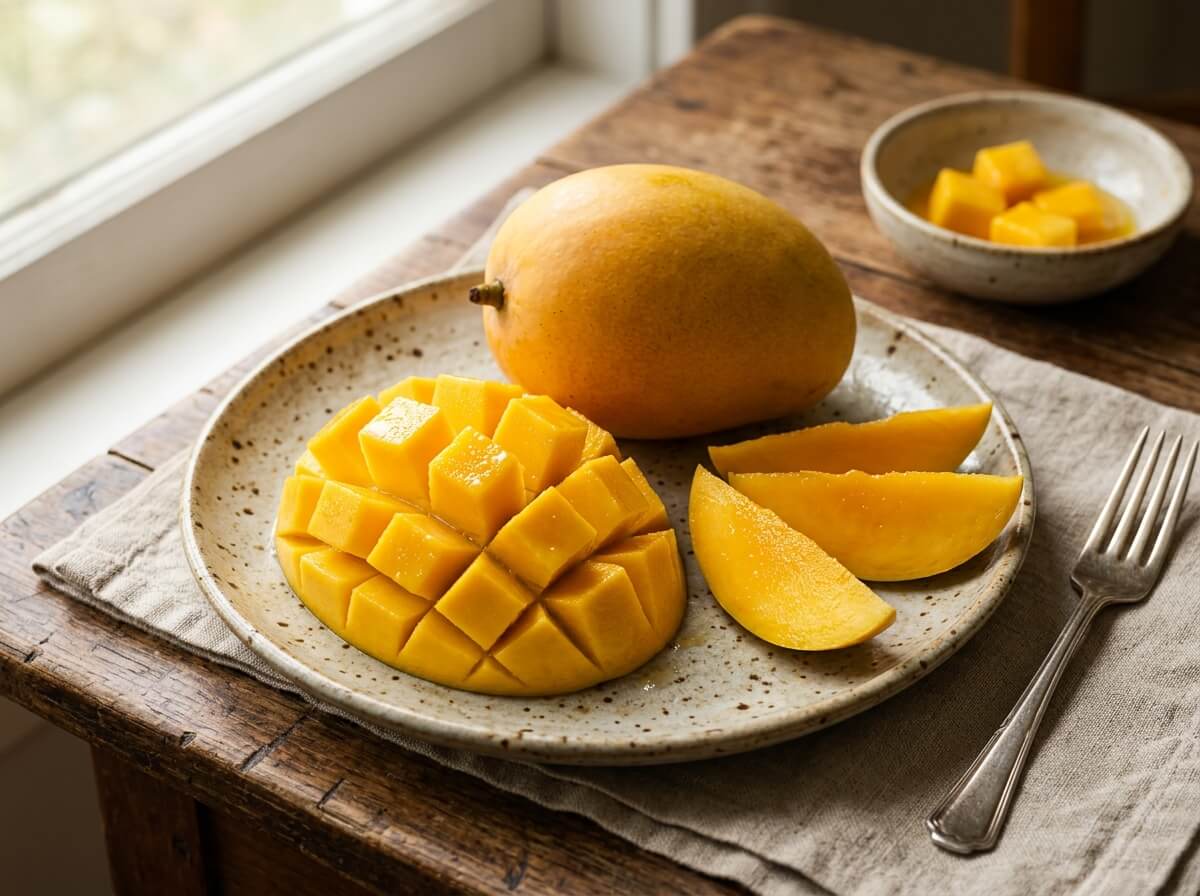
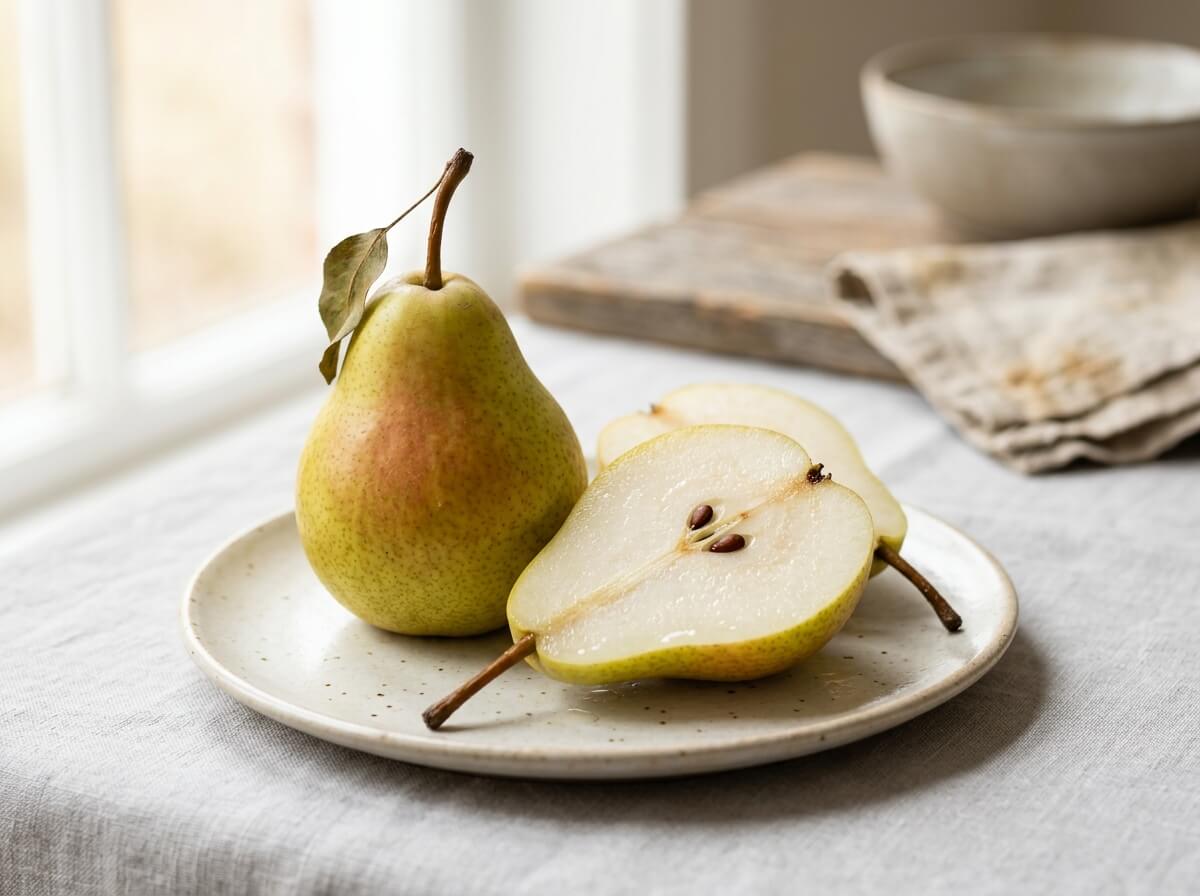
マンゴー vs 洋梨
任意の2つの食品を選択し、マクロ栄養素、ビタミン、ミネラルを並べて比較:100gあたり、1食あたり、またはカロリー正規化。
Nutritional Takeaways
Based on standard 100g edible portion comparison
Pear has fewer calories (energy) (57 kcal vs 60 kcal, 3 kcal less).
Mango provides 0.82 g vs 0.36 g in Pear (+0.46 g, +128%).
Pear provides 3.1 g vs 1.6 g in Mango (+1.5 g, +94%).
Mango provides 36.4 mg vs 4.3 mg in Pear (+32.1 mg, +747%).
三大栄養素6 項目
Mango provides 60 kcal vs 57 kcal in Pear (+3 kcal, +5%).
Mango provides 0.82 g vs 0.36 g in Pear (+0.46 g, +128%).
Both Mango and Pear provide similar amounts of carbohydrates (15.0 g).
Pear provides 3.1 g vs 1.6 g in Mango (+1.5 g, +94%).
Mango provides 0.38 g vs 0.14 g in Pear (+0.24 g, +171%).
Mango provides 13.7 g vs 9.8 g in Pear (+3.9 g, +40%).
ビタミン12 項目
Mango provides 36.4 mg vs 4.3 mg in Pear (+32.1 mg, +747%).
Mango provides 54 µg vs 1.0 µg in Pear (+53 µg, +5300%).
Both Mango and Pear provide similar amounts of vitamin d (0 µg).
Mango provides 0.90 mg vs 0.12 mg in Pear (+0.78 mg, +650%).
Pear provides 4.4 µg vs 4.2 µg in Mango (+0.2 µg, +5%).
Mango provides 43 µg vs 7.0 µg in Pear (+36 µg, +514%).
Both Mango and Pear provide similar amounts of thiamin (vitamin b1) (0.03 mg).
Both Mango and Pear provide similar amounts of riboflavin (vitamin b2) (0.04 mg).
Mango provides 0.67 mg vs 0.16 mg in Pear (+0.51 mg, +316%).
Mango provides slightly more pantothenic acid (b5) (0.20 mg vs 0.05 mg).
Mango provides slightly more vitamin b6 (0.12 mg vs 0.03 mg).
Both Mango and Pear provide similar amounts of vitamin b12 (0 µg).
ミネラル7 項目
Both Mango and Pear provide similar amounts of sodium (1.0 mg).
Mango provides 168 mg vs 116 mg in Pear (+52.0 mg, +45%).
Mango provides 11.0 mg vs 9.0 mg in Pear (+2.0 mg, +22%).
Both Mango and Pear provide similar amounts of iron (0.16 mg).
Mango provides 10.0 mg vs 7.0 mg in Pear (+3.0 mg, +43%).
Mango provides 14.0 mg vs 12.0 mg in Pear (+2.0 mg, +17%).
Both Mango and Pear provide similar amounts of zinc (0.09 mg).
脂質1 項目
Mango provides slightly more saturated fat (0.09 g vs 0.01 g).