Nährwerte im Vergleich

Mango vs Pfirsiche & Nektarinen

Wählen Sie zwei Lebensmittel und vergleichen Sie Makronährstoffe, Vitamine und Mineralstoffe Seite an Seite: pro 100g, pro Portion oder kalorienormalisiert.
Beliebte Vergleiche
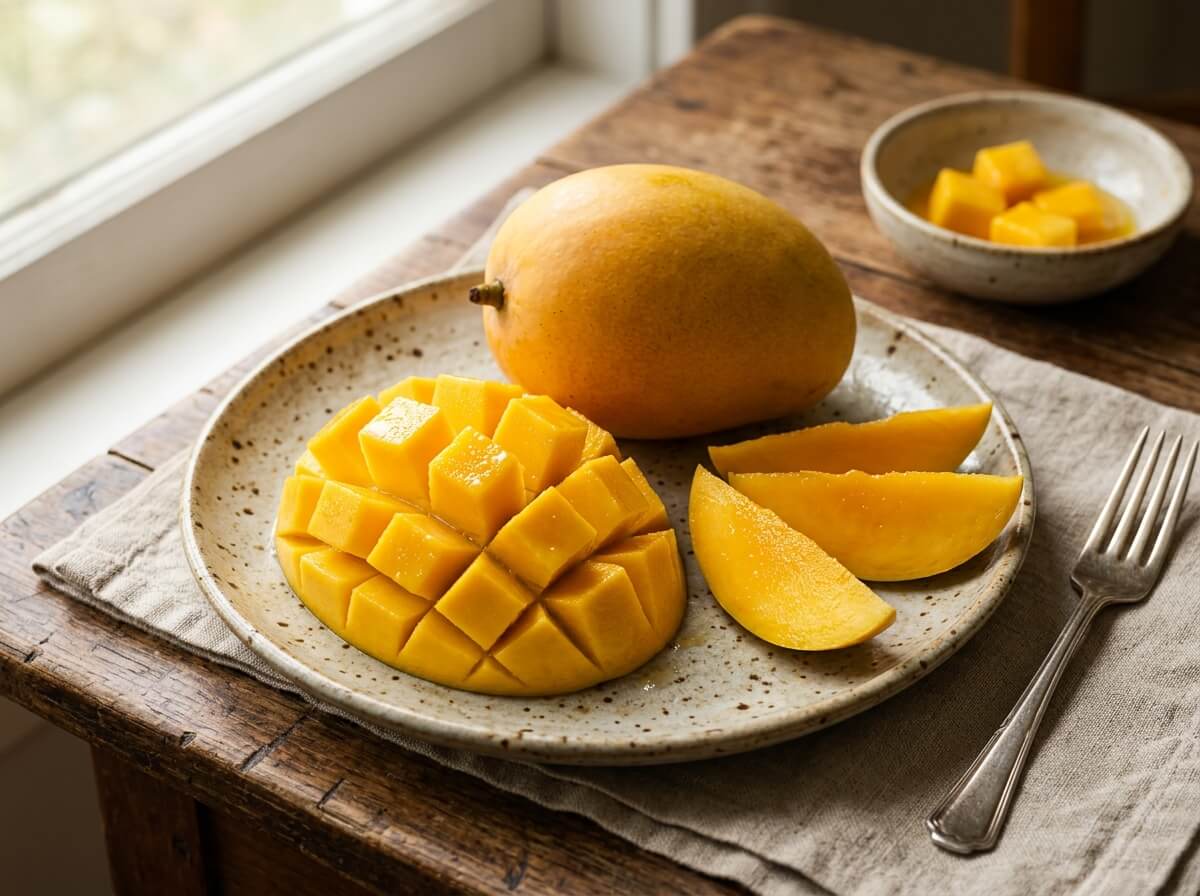
Fresh ripe mango sliced in hedgehog pattern displaying golden juicy cubes
Obst

Mango

60Kalorien
0.8Protein
1.6Ballaststoffe
36.4Vitamin C
Details anzeigen
VS
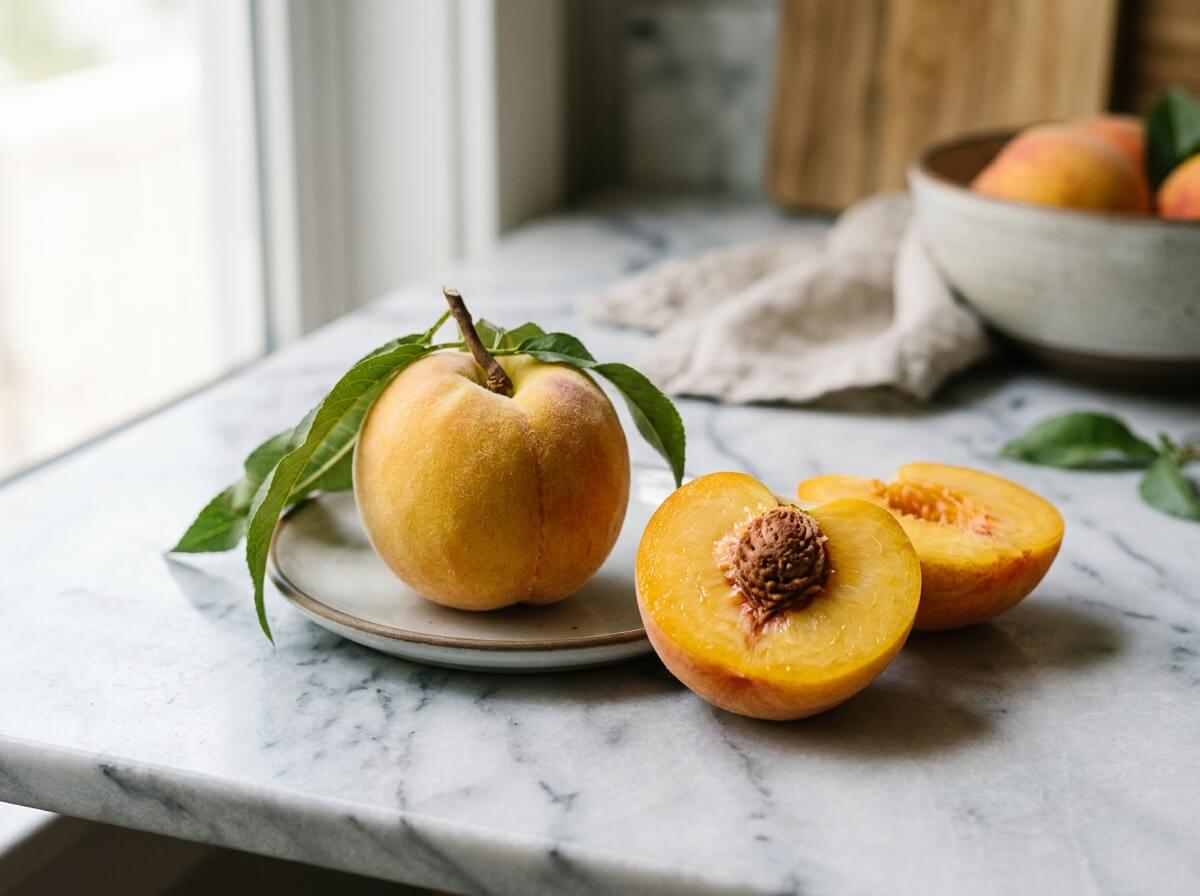
Ripe velvet-skinned peach sliced open showing juicy golden stone fruit flesh
Obst

Pfirsiche & Nektarinen

39Kalorien
0.9Protein
1.5Ballaststoffe
6.6Vitamin C
Details anzeigen
Highlights

Nutritional Takeaways

Based on standard 100g edible portion comparison

Weniger Kalorien
-35%
Pfirsiche & Nektarinen

Peaches & Nectarines has fewer calories (energy) (39 kcal vs 60 kcal, 21 kcal less).

Mehr Protein
+11%
Pfirsiche & Nektarinen

Peaches & Nectarines provides 0.91 g vs 0.82 g in Mango (+0.09 g, +11%).

Mehr Ballaststoffe
+7%
Mango

Mango provides 1.6 g vs 1.5 g in Peaches & Nectarines (+0.10 g, +7%).

Mehr Vitamin C
+452%
Mango

Mango provides 36.4 mg vs 6.6 mg in Peaches & Nectarines (+29.8 mg, +452%).

Comparing per 100 g standard edible portion.

Nährstoff
Mango100 g edible portion
Pfirsiche & Nektarinen100 g edible portion
Makronährstoffe6 Nährstoffe
Kalorien (Energie)Mango höher
Mango
60 kcal3% TB
Pfirsiche & Nektarinen
39 kcal2% TB

Mango provides 60 kcal vs 39 kcal in Peaches & Nectarines (+21 kcal, +54%).

ProteinPfirsiche & Nektarinen höher
Mango
0.82 g2% TB
Pfirsiche & Nektarinen
0.91 g2% TB

Peaches & Nectarines provides 0.91 g vs 0.82 g in Mango (+0.09 g, +11%).

KohlenhydrateMango höher
Mango
15.0 g5% TB
Pfirsiche & Nektarinen
9.5 g3% TB

Mango provides 15.0 g vs 9.5 g in Peaches & Nectarines (+5.4 g, +57%).

BallaststoffeMango höher
Mango
1.6 g6% TB
Pfirsiche & Nektarinen
1.5 g5% TB

Mango provides 1.6 g vs 1.5 g in Peaches & Nectarines (+0.10 g, +7%).

GesamtfettMango höher
Mango
0.38 g
Pfirsiche & Nektarinen
0.25 g

Mango provides 0.38 g vs 0.25 g in Peaches & Nectarines (+0.13 g, +52%).

ZuckerMango höher
Mango
13.7 g27% TB
Pfirsiche & Nektarinen
8.4 g17% TB

Mango provides 13.7 g vs 8.4 g in Peaches & Nectarines (+5.3 g, +63%).

Vitamine12 Nährstoffe
Vitamin CMango höher
Mango
36.4 mg40% TB
Pfirsiche & Nektarinen
6.6 mg7% TB

Mango provides 36.4 mg vs 6.6 mg in Peaches & Nectarines (+29.8 mg, +452%).

Vitamin AMango höher
Mango
54 µg6% TB
Pfirsiche & Nektarinen
16 µg2% TB

Mango provides 54 µg vs 16 µg in Peaches & Nectarines (+38 µg, +238%).

Vitamin DÄhnlich
Mango
0 µg
Pfirsiche & Nektarinen
0 µg

Both Mango and Peaches & Nectarines provide similar amounts of vitamin d (0 µg).

Vitamin EMango höher
Mango
0.90 mg6% TB
Pfirsiche & Nektarinen
0.73 mg5% TB

Mango provides 0.90 mg vs 0.73 mg in Peaches & Nectarines (+0.17 mg, +23%).

Vitamin KMango höher
Mango
4.2 µg4% TB
Pfirsiche & Nektarinen
2.6 µg2% TB

Mango provides 4.2 µg vs 2.6 µg in Peaches & Nectarines (+1.6 µg, +62%).

FolsäureMango höher
Mango
43 µg11% TB
Pfirsiche & Nektarinen
4.0 µg1% TB

Mango provides 43 µg vs 4.0 µg in Peaches & Nectarines (+39 µg, +975%).

Vitamin B1 (Thiamin)Ähnlich
Mango
0.03 mg2% TB
Pfirsiche & Nektarinen
0.02 mg2% TB

Both Mango and Peaches & Nectarines provide similar amounts of thiamin (vitamin b1) (0.03 mg).

Vitamin B2 (Riboflavin)Ähnlich
Mango
0.04 mg3% TB
Pfirsiche & Nektarinen
0.03 mg2% TB

Both Mango and Peaches & Nectarines provide similar amounts of riboflavin (vitamin b2) (0.04 mg).

Vitamin B3 (Niacin)Pfirsiche & Nektarinen höher
Mango
0.67 mg4% TB
Pfirsiche & Nektarinen
0.81 mg5% TB

Peaches & Nectarines provides 0.81 mg vs 0.67 mg in Mango (+0.14 mg, +20%).

Vitamin B5Ähnlich
Mango
0.20 mg4% TB
Pfirsiche & Nektarinen
0.15 mg3% TB

Both Mango and Peaches & Nectarines provide similar amounts of pantothenic acid (b5) (0.20 mg).

Vitamin B6Mango höher
Mango
0.12 mg7% TB
Pfirsiche & Nektarinen
0.03 mg1% TB

Mango provides slightly more vitamin b6 (0.12 mg vs 0.03 mg).

Vitamin B12Ähnlich
Mango
0 µg
Pfirsiche & Nektarinen
0 µg

Both Mango and Peaches & Nectarines provide similar amounts of vitamin b12 (0 µg).

Mineralstoffe7 Nährstoffe
NatriumMango höher
Mango
1.0 mg
Pfirsiche & Nektarinen
0 mg

Mango has higher sodium (1.0 mg vs 0 mg).

KaliumPfirsiche & Nektarinen höher
Mango
168 mg4% TB
Pfirsiche & Nektarinen
190 mg4% TB

Peaches & Nectarines provides 190 mg vs 168 mg in Mango (+22.0 mg, +13%).

CalciumMango höher
Mango
11.0 mg1% TB
Pfirsiche & Nektarinen
6.0 mg

Mango provides 11.0 mg vs 6.0 mg in Peaches & Nectarines (+5.0 mg, +83%).

EisenPfirsiche & Nektarinen höher
Mango
0.16 mg1% TB
Pfirsiche & Nektarinen
0.25 mg1% TB

Peaches & Nectarines provides 0.25 mg vs 0.16 mg in Mango (+0.09 mg, +56%).

MagnesiumMango höher
Mango
10.0 mg2% TB
Pfirsiche & Nektarinen
9.0 mg2% TB

Mango provides 10.0 mg vs 9.0 mg in Peaches & Nectarines (+1.0 mg, +11%).

PhosphorPfirsiche & Nektarinen höher
Mango
14.0 mg1% TB
Pfirsiche & Nektarinen
20.0 mg2% TB

Peaches & Nectarines provides 20.0 mg vs 14.0 mg in Mango (+6.0 mg, +43%).

ZinkPfirsiche & Nektarinen höher
Mango
0.09 mg1% TB
Pfirsiche & Nektarinen
0.17 mg2% TB

Peaches & Nectarines provides slightly more zinc (0.17 mg vs 0.09 mg).

Lipide1 Nährstoffe
Gesättigte FettsäurenMango höher
Mango
0.09 g
Pfirsiche & Nektarinen
0.02 g

Mango provides slightly more saturated fat (0.09 g vs 0.02 g).

Zusammenfassung des Vergleichs

Based on 26 nutrients analyzed, Mango leads in 15 categories while Peaches & Nectarines leads in 6.Both foods show similar concentrations in 5 nutrients. Overall, Mango has the nutritional edge in this comparison.

0 Lebensmittel
Vergleichen (0/2)