Nährwerte im Vergleich

Pfirsiche & Nektarinen vs Lachs

Wählen Sie zwei Lebensmittel und vergleichen Sie Makronährstoffe, Vitamine und Mineralstoffe Seite an Seite: pro 100g, pro Portion oder kalorienormalisiert.
Beliebte Vergleiche
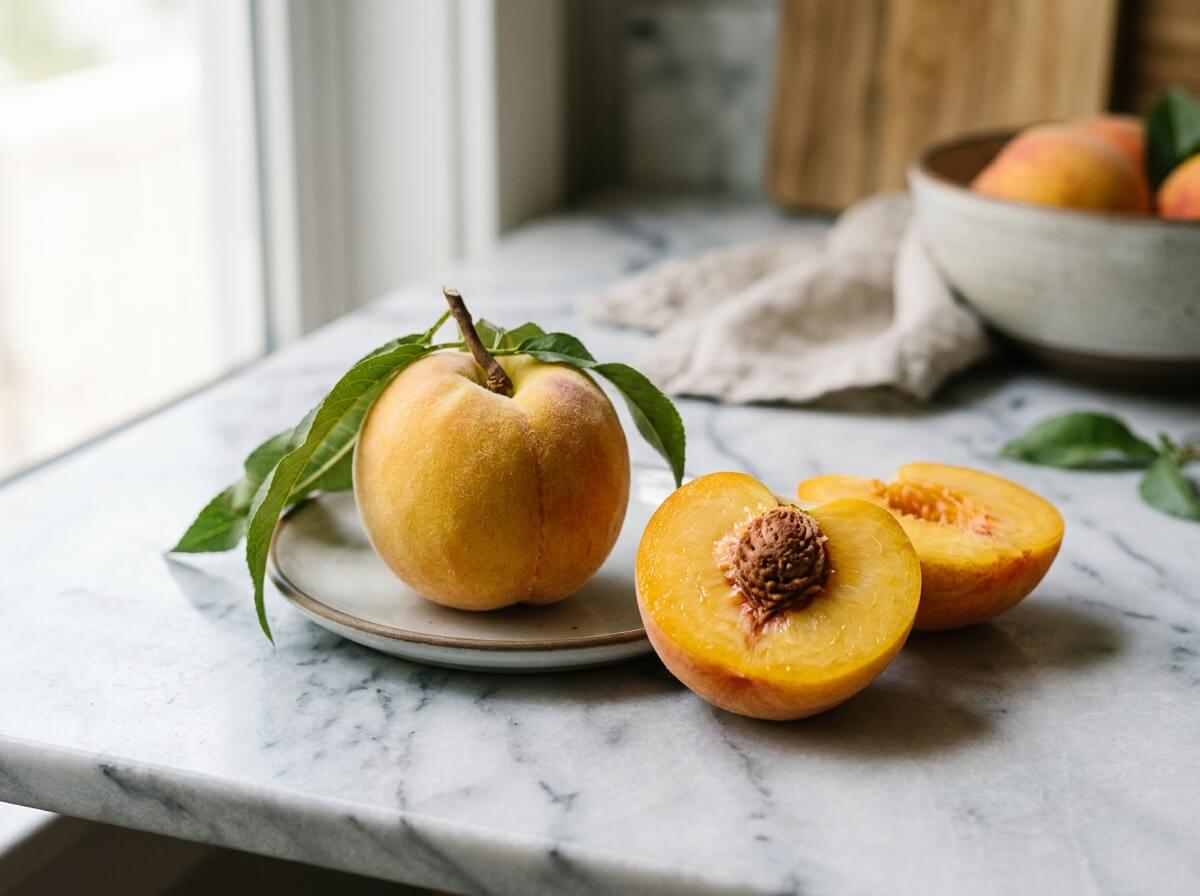
Ripe velvet-skinned peach sliced open showing juicy golden stone fruit flesh
Obst

Pfirsiche & Nektarinen

39Kalorien
0.9Protein
1.5Ballaststoffe
6.6Vitamin C
Details anzeigen
VS
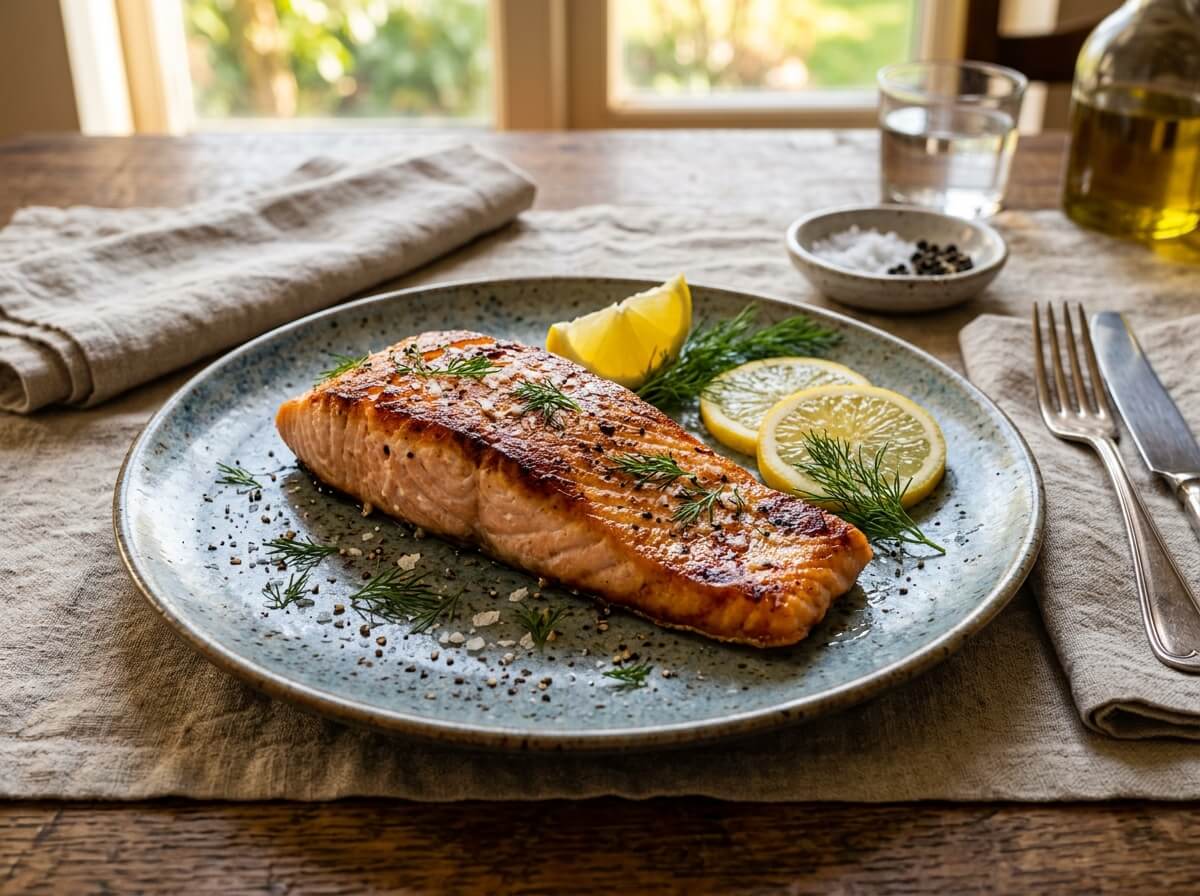
Clean pan-seared salmon fillet displaying delicate pink flaky texture
Fisch & Meeresfrüchte

Lachs

206Kalorien
22.1Protein
0.0Ballaststoffe
0.0Vitamin C
Details anzeigen
Preparation State Notice

Comparing Peaches & Nectarines (raw) with Atlantic Salmon (Cooked/Baked) (cooked). Moisture variations and cooking state affect nutrient concentrations.

Highlights

Nutritional Takeaways

Based on standard 100g edible portion comparison

Weniger Kalorien
-81%
Pfirsiche & Nektarinen

Peaches & Nectarines has fewer calories (energy) (39 kcal vs 206 kcal, 167 kcal less).

Mehr Protein
+2329%
Lachs

Atlantic Salmon (Cooked/Baked) provides 22.1 g vs 0.91 g in Peaches & Nectarines (+21.2 g, +2329%).

Mehr Ballaststoffe
Pfirsiche & Nektarinen

Peaches & Nectarines provides 1.5 g vs 0 g in Atlantic Salmon (Cooked/Baked) (+1.5 g).

Mehr Vitamin C
Pfirsiche & Nektarinen

Peaches & Nectarines provides 6.6 mg vs 0 mg in Atlantic Salmon (Cooked/Baked) (+6.6 mg).

Comparing per 100 g standard edible portion.

Nährstoff
Pfirsiche & Nektarinen100 g edible portion
Lachs100 g edible portion
Makronährstoffe6 Nährstoffe
Kalorien (Energie)Lachs höher
Pfirsiche & Nektarinen
39 kcal2% TB
Lachs
206 kcal10% TB

Atlantic Salmon (Cooked/Baked) provides 206 kcal vs 39 kcal in Peaches & Nectarines (+167 kcal, +428%).

ProteinLachs höher
Pfirsiche & Nektarinen
0.91 g2% TB
Lachs
22.1 g44% TB

Atlantic Salmon (Cooked/Baked) provides 22.1 g vs 0.91 g in Peaches & Nectarines (+21.2 g, +2329%).

KohlenhydratePfirsiche & Nektarinen höher
Pfirsiche & Nektarinen
9.5 g3% TB
Lachs
0 g

Peaches & Nectarines has higher carbohydrates (9.5 g vs 0 g).

BallaststoffePfirsiche & Nektarinen höher
Pfirsiche & Nektarinen
1.5 g5% TB
Lachs
0 g

Peaches & Nectarines has higher dietary fiber (1.5 g vs 0 g).

GesamtfettLachs höher
Pfirsiche & Nektarinen
0.25 g
Lachs
12.4 g16% TB

Atlantic Salmon (Cooked/Baked) provides 12.4 g vs 0.25 g in Peaches & Nectarines (+12.1 g, +4840%).

ZuckerPfirsiche & Nektarinen höher
Pfirsiche & Nektarinen
8.4 g17% TB
Lachs
0 g

Peaches & Nectarines has higher total sugars (8.4 g vs 0 g).

Vitamine12 Nährstoffe
Vitamin CPfirsiche & Nektarinen höher
Pfirsiche & Nektarinen
6.6 mg7% TB
Lachs
0 mg

Peaches & Nectarines has higher vitamin c (6.6 mg vs 0 mg).

Vitamin APfirsiche & Nektarinen höher
Pfirsiche & Nektarinen
16 µg2% TB
Lachs
12 µg1% TB

Peaches & Nectarines provides 16 µg vs 12 µg in Atlantic Salmon (Cooked/Baked) (+4.0 µg, +33%).

Vitamin DLachs höher
Pfirsiche & Nektarinen
0 µg
Lachs
11 µg55% TB

Atlantic Salmon (Cooked/Baked) has higher vitamin d (11 µg vs 0 µg).

Vitamin ELachs höher
Pfirsiche & Nektarinen
0.73 mg5% TB
Lachs
3.6 mg24% TB

Atlantic Salmon (Cooked/Baked) provides 3.6 mg vs 0.73 mg in Peaches & Nectarines (+2.8 mg, +386%).

Vitamin KPfirsiche & Nektarinen höher
Pfirsiche & Nektarinen
2.6 µg2% TB
Lachs
0.1 µg

Peaches & Nectarines provides 2.6 µg vs 0.1 µg in Atlantic Salmon (Cooked/Baked) (+2.5 µg, +2500%).

FolsäureLachs höher
Pfirsiche & Nektarinen
4.0 µg1% TB
Lachs
29 µg7% TB

Atlantic Salmon (Cooked/Baked) provides 29 µg vs 4.0 µg in Peaches & Nectarines (+25 µg, +625%).

Vitamin B1 (Thiamin)Lachs höher
Pfirsiche & Nektarinen
0.02 mg2% TB
Lachs
0.23 mg19% TB

Atlantic Salmon (Cooked/Baked) provides 0.23 mg vs 0.02 mg in Peaches & Nectarines (+0.20 mg, +842%).

Vitamin B2 (Riboflavin)Lachs höher
Pfirsiche & Nektarinen
0.03 mg2% TB
Lachs
0.14 mg10% TB

Atlantic Salmon (Cooked/Baked) provides slightly more riboflavin (vitamin b2) (0.14 mg vs 0.03 mg).

Vitamin B3 (Niacin)Lachs höher
Pfirsiche & Nektarinen
0.81 mg5% TB
Lachs
8.7 mg54% TB

Atlantic Salmon (Cooked/Baked) provides 8.7 mg vs 0.81 mg in Peaches & Nectarines (+7.8 mg, +973%).

Vitamin B5Lachs höher
Pfirsiche & Nektarinen
0.15 mg3% TB
Lachs
1.7 mg33% TB

Atlantic Salmon (Cooked/Baked) provides 1.7 mg vs 0.15 mg in Peaches & Nectarines (+1.5 mg, +985%).

Vitamin B6Lachs höher
Pfirsiche & Nektarinen
0.03 mg1% TB
Lachs
0.64 mg38% TB

Atlantic Salmon (Cooked/Baked) provides 0.64 mg vs 0.03 mg in Peaches & Nectarines (+0.62 mg, +2460%).

Vitamin B12Lachs höher
Pfirsiche & Nektarinen
0 µg
Lachs
3.2 µg133% TB

Atlantic Salmon (Cooked/Baked) has higher vitamin b12 (3.2 µg vs 0 µg).

Mineralstoffe7 Nährstoffe
NatriumLachs höher
Pfirsiche & Nektarinen
0 mg
Lachs
60.0 mg3% TB

Atlantic Salmon (Cooked/Baked) has higher sodium (60.0 mg vs 0 mg).

KaliumLachs höher
Pfirsiche & Nektarinen
190 mg4% TB
Lachs
384 mg8% TB

Atlantic Salmon (Cooked/Baked) provides 384 mg vs 190 mg in Peaches & Nectarines (+194 mg, +102%).

CalciumLachs höher
Pfirsiche & Nektarinen
6.0 mg
Lachs
12.0 mg1% TB

Atlantic Salmon (Cooked/Baked) provides 12.0 mg vs 6.0 mg in Peaches & Nectarines (+6.0 mg, +100%).

EisenLachs höher
Pfirsiche & Nektarinen
0.25 mg1% TB
Lachs
0.80 mg4% TB

Atlantic Salmon (Cooked/Baked) provides 0.80 mg vs 0.25 mg in Peaches & Nectarines (+0.55 mg, +220%).

MagnesiumLachs höher
Pfirsiche & Nektarinen
9.0 mg2% TB
Lachs
30.0 mg7% TB

Atlantic Salmon (Cooked/Baked) provides 30.0 mg vs 9.0 mg in Peaches & Nectarines (+21.0 mg, +233%).

PhosphorLachs höher
Pfirsiche & Nektarinen
20.0 mg2% TB
Lachs
252 mg20% TB

Atlantic Salmon (Cooked/Baked) provides 252 mg vs 20.0 mg in Peaches & Nectarines (+232 mg, +1160%).

ZinkLachs höher
Pfirsiche & Nektarinen
0.17 mg2% TB
Lachs
0.64 mg6% TB

Atlantic Salmon (Cooked/Baked) provides 0.64 mg vs 0.17 mg in Peaches & Nectarines (+0.47 mg, +276%).

Lipide1 Nährstoffe
Gesättigte FettsäurenLachs höher
Pfirsiche & Nektarinen
0.02 g
Lachs
2.5 g13% TB

Atlantic Salmon (Cooked/Baked) provides 2.5 g vs 0.02 g in Peaches & Nectarines (+2.5 g, +13058%).

Zusammenfassung des Vergleichs

Based on 26 nutrients analyzed, Peaches & Nectarines leads in 6 categories while Atlantic Salmon (Cooked/Baked) leads in 20. Overall, Lachs has the nutritional edge in this comparison.

0 Lebensmittel
Vergleichen (0/2)